Zip Codes with the Highest Percentage of Population Employed in Installation, Maintenance & Repair in Griffin, GA
RELATED REPORTS & OPTIONS
Installation, Maintenance & Repair
Griffin
Compare Zip Codes
Map of Zip Codes with the Highest Percentage of Population Employed in Installation, Maintenance & Repair in Griffin
5.4%
6.3%
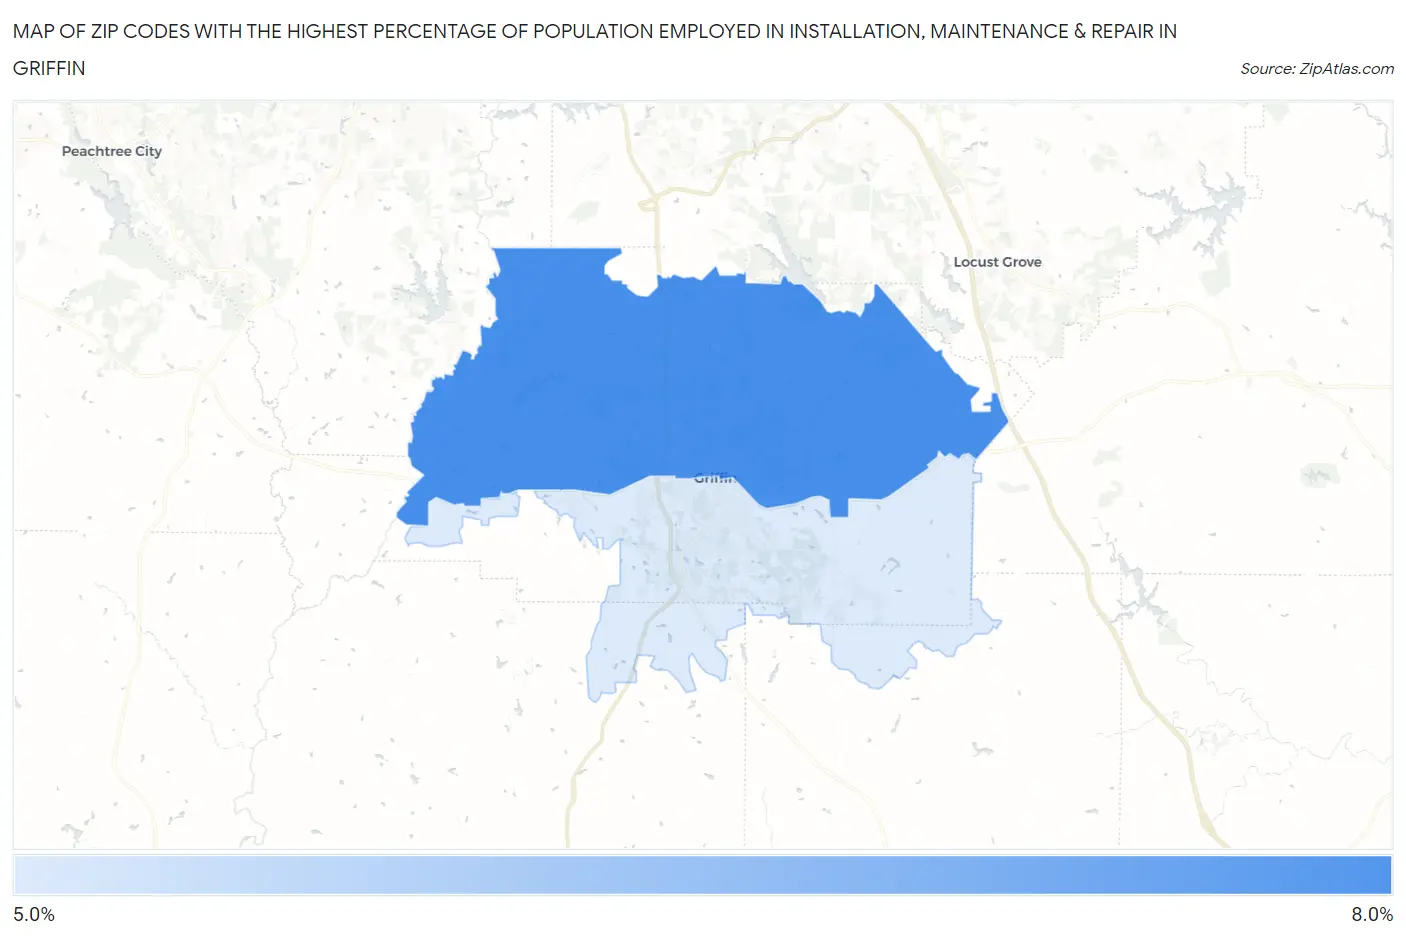
Zip Codes with the Highest Percentage of Population Employed in Installation, Maintenance & Repair in Griffin, GA
| Zip Code | % Employed | vs State | vs National | |
| 1. | 30223 | 6.3% | 3.4%(+2.98)#150 | 3.1%(+3.27)#5,468 |
| 2. | 30224 | 5.4% | 3.4%(+2.04)#206 | 3.1%(+2.34)#7,513 |
1
Common Questions
What are the Top Zip Codes with the Highest Percentage of Population Employed in Installation, Maintenance & Repair in Griffin, GA?
Top Zip Codes with the Highest Percentage of Population Employed in Installation, Maintenance & Repair in Griffin, GA are:
What zip code has the Highest Percentage of Population Employed in Installation, Maintenance & Repair in Griffin, GA?
30223 has the Highest Percentage of Population Employed in Installation, Maintenance & Repair in Griffin, GA with 6.3%.
What is the Percentage of Population Employed in Installation, Maintenance & Repair in Griffin, GA?
Percentage of Population Employed in Installation, Maintenance & Repair in Griffin is 4.8%.
What is the Percentage of Population Employed in Installation, Maintenance & Repair in Georgia?
Percentage of Population Employed in Installation, Maintenance & Repair in Georgia is 3.4%.
What is the Percentage of Population Employed in Installation, Maintenance & Repair in the United States?
Percentage of Population Employed in Installation, Maintenance & Repair in the United States is 3.1%.