Zip Codes with the Highest Percentage of Households Without a Vehicle in Brunswick, GA
RELATED REPORTS & OPTIONS
Households without a Cars
Brunswick
Compare Zip Codes
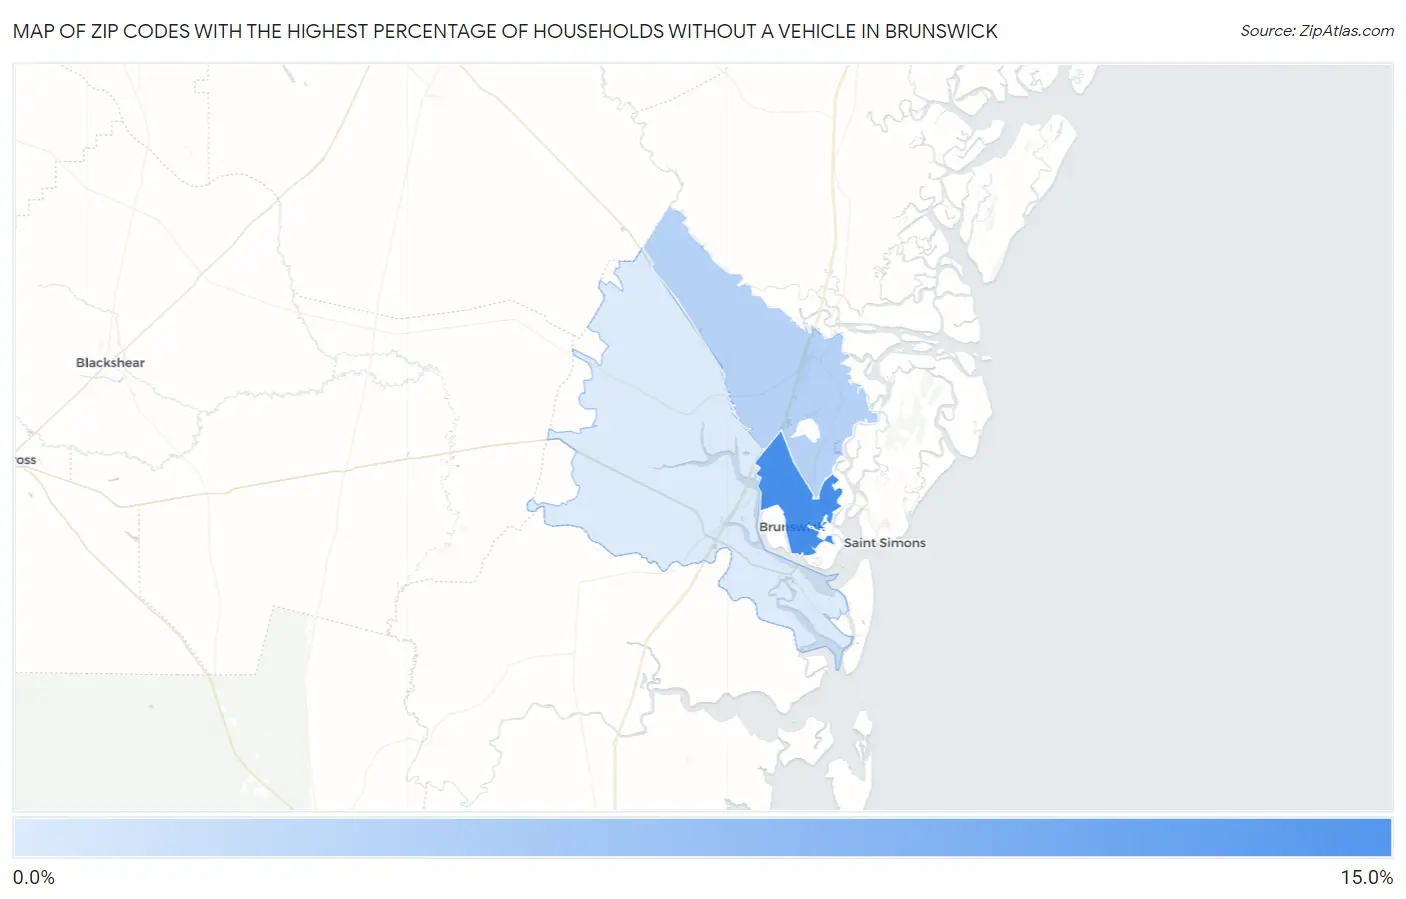
Map of Zip Codes with the Highest Percentage of Households Without a Vehicle in Brunswick
1.3%
13.2%
Zip Codes with the Highest Percentage of Households Without a Vehicle in Brunswick, GA
| Zip Code | Housholds Without a Car | vs State | vs National | |
| 1. | 31520 | 13.2% | 6.0%(+7.20)#56 | 8.3%(+4.90)#3,006 |
| 2. | 31525 | 4.3% | 6.0%(-1.70)#347 | 8.3%(-4.00)#14,799 |
| 3. | 31523 | 1.3% | 6.0%(-4.70)#595 | 8.3%(-7.00)#24,757 |
1
Common Questions
What are the Top Zip Codes with the Highest Percentage of Households Without a Vehicle in Brunswick, GA?
Top Zip Codes with the Highest Percentage of Households Without a Vehicle in Brunswick, GA are:
What zip code has the Highest Percentage of Households Without a Vehicle in Brunswick, GA?
31520 has the Highest Percentage of Households Without a Vehicle in Brunswick, GA with 13.2%.
What is the Percentage of Households Without a Vehicle in Brunswick, GA?
Percentage of Households Without a Vehicle in Brunswick is 16.5%.
What is the Percentage of Households Without a Vehicle in Georgia?
Percentage of Households Without a Vehicle in Georgia is 6.0%.
What is the Percentage of Households Without a Vehicle in the United States?
Percentage of Households Without a Vehicle in the United States is 8.3%.