Yup'ik vs Nonimmigrants Married-couple Households
COMPARE
Yup'ik
Nonimmigrants
Married-couple Households
Married-couple Households Comparison
Yup'ik
Nonimmigrants
44.1%
MARRIED-COUPLE HOUSEHOLDS
0.4/ 100
METRIC RATING
248th/ 347
METRIC RANK
46.9%
MARRIED-COUPLE HOUSEHOLDS
73.3/ 100
METRIC RATING
158th/ 347
METRIC RANK
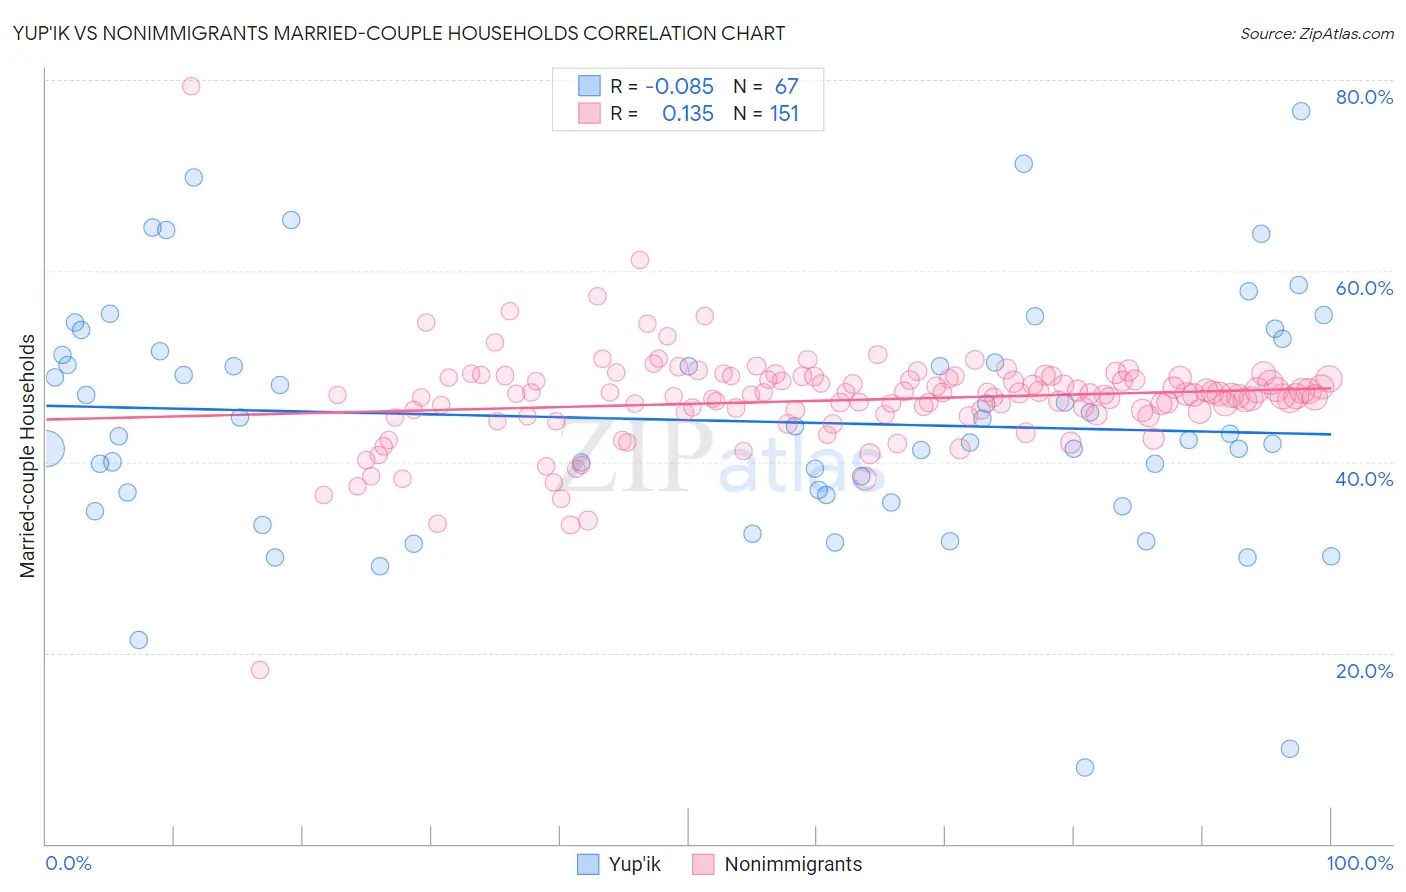
Yup'ik vs Nonimmigrants Married-couple Households Correlation Chart
The statistical analysis conducted on geographies consisting of 39,956,684 people shows a slight negative correlation between the proportion of Yup'ik and percentage of married-couple family households in the United States with a correlation coefficient (R) of -0.085 and weighted average of 44.1%. Similarly, the statistical analysis conducted on geographies consisting of 584,564,582 people shows a poor positive correlation between the proportion of Nonimmigrants and percentage of married-couple family households in the United States with a correlation coefficient (R) of 0.135 and weighted average of 46.9%, a difference of 6.4%.
Married-couple Households Correlation Summary
| Measurement | Yup'ik | Nonimmigrants |
| Minimum | 8.0% | 18.2% |
| Maximum | 76.7% | 79.3% |
| Range | 68.7% | 61.2% |
| Mean | 44.4% | 46.5% |
| Median | 42.9% | 47.0% |
| Interquartile 25% (IQ1) | 36.5% | 45.0% |
| Interquartile 75% (IQ3) | 51.5% | 48.7% |
| Interquartile Range (IQR) | 15.1% | 3.7% |
| Standard Deviation (Sample) | 12.8% | 5.5% |
| Standard Deviation (Population) | 12.8% | 5.5% |
Similar Demographics by Married-couple Households
Demographics Similar to Yup'ik by Married-couple Households
In terms of married-couple households, the demographic groups most similar to Yup'ik are Immigrants from Kenya (44.1%, a difference of 0.050%), French American Indian (44.1%, a difference of 0.050%), German Russian (44.0%, a difference of 0.14%), Seminole (44.0%, a difference of 0.20%), and Immigrants from Cuba (44.2%, a difference of 0.28%).
| Demographics | Rating | Rank | Married-couple Households |
| Immigrants | Bosnia and Herzegovina | 1.0 /100 | #241 | Tragic 44.4% |
| Immigrants | Albania | 1.0 /100 | #242 | Tragic 44.4% |
| Immigrants | Saudi Arabia | 0.9 /100 | #243 | Tragic 44.4% |
| Immigrants | Armenia | 0.7 /100 | #244 | Tragic 44.3% |
| Immigrants | El Salvador | 0.7 /100 | #245 | Tragic 44.3% |
| Immigrants | Cuba | 0.6 /100 | #246 | Tragic 44.2% |
| Immigrants | Morocco | 0.6 /100 | #247 | Tragic 44.2% |
| Yup'ik | 0.4 /100 | #248 | Tragic 44.1% |
| Immigrants | Kenya | 0.4 /100 | #249 | Tragic 44.1% |
| French American Indians | 0.4 /100 | #250 | Tragic 44.1% |
| German Russians | 0.4 /100 | #251 | Tragic 44.0% |
| Seminole | 0.4 /100 | #252 | Tragic 44.0% |
| Central Americans | 0.3 /100 | #253 | Tragic 43.9% |
| Apache | 0.3 /100 | #254 | Tragic 43.9% |
| Shoshone | 0.3 /100 | #255 | Tragic 43.9% |
Demographics Similar to Nonimmigrants by Married-couple Households
In terms of married-couple households, the demographic groups most similar to Nonimmigrants are Osage (46.9%, a difference of 0.0%), Iraqi (46.9%, a difference of 0.070%), Immigrants from Oceania (46.9%, a difference of 0.080%), Armenian (46.9%, a difference of 0.10%), and Delaware (46.8%, a difference of 0.10%).
| Demographics | Rating | Rank | Married-couple Households |
| Immigrants | Bulgaria | 76.8 /100 | #151 | Good 47.0% |
| Serbians | 76.3 /100 | #152 | Good 47.0% |
| Hmong | 76.2 /100 | #153 | Good 47.0% |
| Immigrants | Western Asia | 76.1 /100 | #154 | Good 46.9% |
| Arabs | 76.0 /100 | #155 | Good 46.9% |
| Armenians | 75.4 /100 | #156 | Good 46.9% |
| Immigrants | Oceania | 74.8 /100 | #157 | Good 46.9% |
| Immigrants | Nonimmigrants | 73.3 /100 | #158 | Good 46.9% |
| Osage | 73.2 /100 | #159 | Good 46.9% |
| Iraqis | 71.7 /100 | #160 | Good 46.9% |
| Delaware | 71.2 /100 | #161 | Good 46.8% |
| Colombians | 71.0 /100 | #162 | Good 46.8% |
| Immigrants | Turkey | 70.2 /100 | #163 | Good 46.8% |
| Immigrants | Kazakhstan | 70.0 /100 | #164 | Good 46.8% |
| Immigrants | Southern Europe | 69.9 /100 | #165 | Good 46.8% |