Yaqui vs Immigrants from Romania Family Households
COMPARE
Yaqui
Immigrants from Romania
Family Households
Family Households Comparison
Yaqui
Immigrants from Romania
65.6%
FAMILY HOUSEHOLDS
99.8/ 100
METRIC RATING
78th/ 347
METRIC RANK
64.6%
FAMILY HOUSEHOLDS
77.0/ 100
METRIC RATING
146th/ 347
METRIC RANK
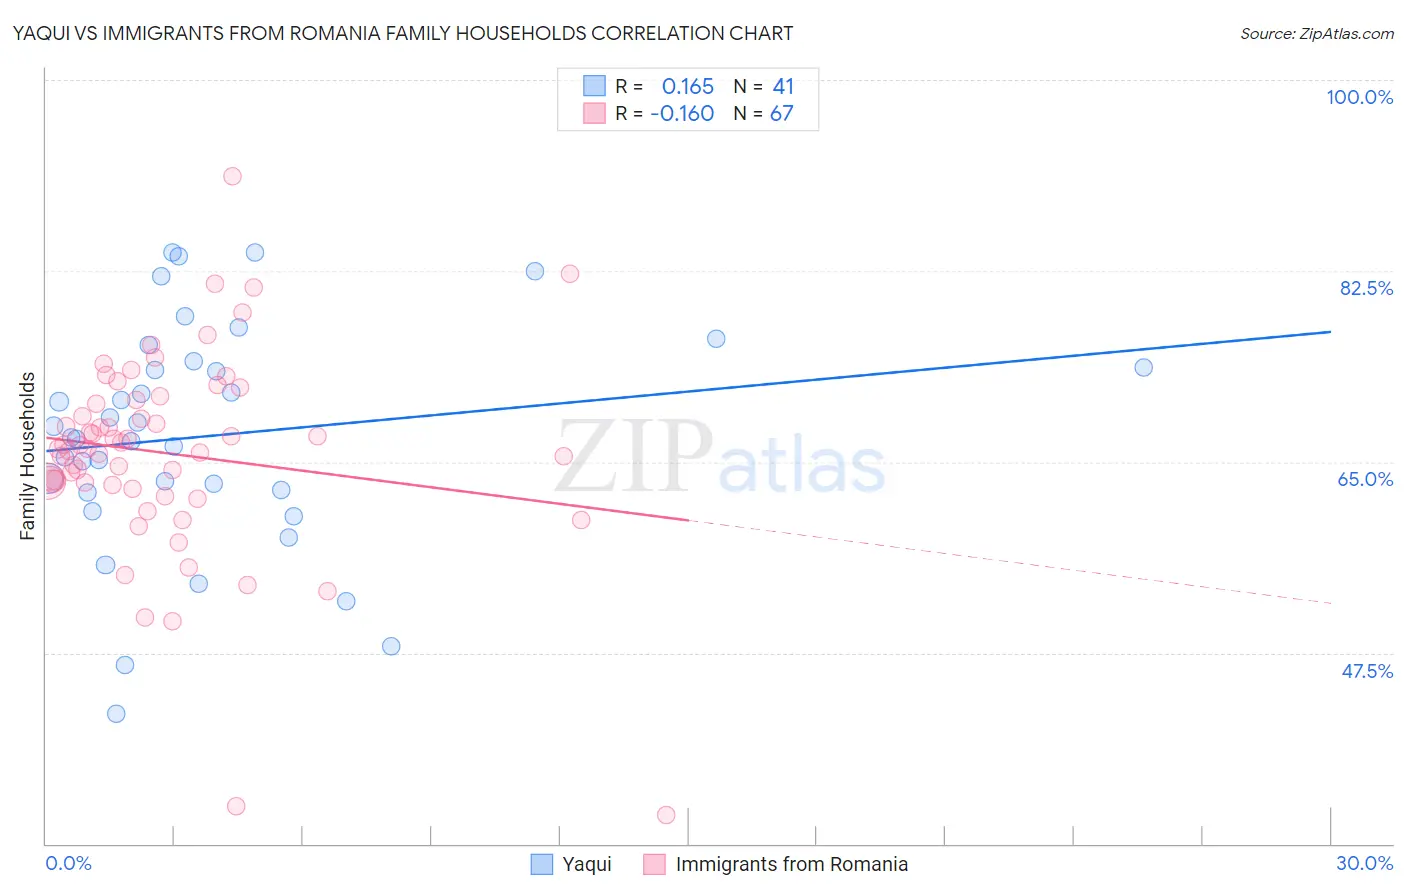
Yaqui vs Immigrants from Romania Family Households Correlation Chart
The statistical analysis conducted on geographies consisting of 107,720,236 people shows a poor positive correlation between the proportion of Yaqui and percentage of family households in the United States with a correlation coefficient (R) of 0.165 and weighted average of 65.6%. Similarly, the statistical analysis conducted on geographies consisting of 256,963,245 people shows a poor negative correlation between the proportion of Immigrants from Romania and percentage of family households in the United States with a correlation coefficient (R) of -0.160 and weighted average of 64.6%, a difference of 1.7%.
Family Households Correlation Summary
| Measurement | Yaqui | Immigrants from Romania |
| Minimum | 41.9% | 32.6% |
| Maximum | 84.2% | 91.2% |
| Range | 42.3% | 58.6% |
| Mean | 67.4% | 65.8% |
| Median | 67.2% | 66.2% |
| Interquartile 25% (IQ1) | 62.3% | 62.9% |
| Interquartile 75% (IQ3) | 73.9% | 70.7% |
| Interquartile Range (IQR) | 11.6% | 7.8% |
| Standard Deviation (Sample) | 10.2% | 9.4% |
| Standard Deviation (Population) | 10.1% | 9.3% |
Similar Demographics by Family Households
Demographics Similar to Yaqui by Family Households
In terms of family households, the demographic groups most similar to Yaqui are Immigrants from South America (65.6%, a difference of 0.0%), Immigrants from the Azores (65.6%, a difference of 0.010%), Immigrants from Costa Rica (65.6%, a difference of 0.030%), Puget Sound Salish (65.6%, a difference of 0.050%), and Houma (65.7%, a difference of 0.12%).
| Demographics | Rating | Rank | Family Households |
| Bhutanese | 99.9 /100 | #71 | Exceptional 65.9% |
| Portuguese | 99.9 /100 | #72 | Exceptional 65.8% |
| Laotians | 99.9 /100 | #73 | Exceptional 65.8% |
| Burmese | 99.9 /100 | #74 | Exceptional 65.7% |
| Houma | 99.9 /100 | #75 | Exceptional 65.7% |
| Immigrants | Azores | 99.8 /100 | #76 | Exceptional 65.6% |
| Immigrants | South America | 99.8 /100 | #77 | Exceptional 65.6% |
| Yaqui | 99.8 /100 | #78 | Exceptional 65.6% |
| Immigrants | Costa Rica | 99.8 /100 | #79 | Exceptional 65.6% |
| Puget Sound Salish | 99.8 /100 | #80 | Exceptional 65.6% |
| Jordanians | 99.7 /100 | #81 | Exceptional 65.5% |
| Immigrants | Lebanon | 99.7 /100 | #82 | Exceptional 65.5% |
| Immigrants | Guyana | 99.6 /100 | #83 | Exceptional 65.5% |
| Americans | 99.6 /100 | #84 | Exceptional 65.5% |
| Immigrants | Cambodia | 99.5 /100 | #85 | Exceptional 65.4% |
Demographics Similar to Immigrants from Romania by Family Households
In terms of family households, the demographic groups most similar to Immigrants from Romania are Immigrants from Chile (64.6%, a difference of 0.010%), Delaware (64.6%, a difference of 0.010%), Sioux (64.6%, a difference of 0.010%), Romanian (64.5%, a difference of 0.030%), and Syrian (64.5%, a difference of 0.030%).
| Demographics | Rating | Rank | Family Households |
| Immigrants | Jamaica | 85.3 /100 | #139 | Excellent 64.7% |
| Immigrants | North Macedonia | 84.9 /100 | #140 | Excellent 64.7% |
| Immigrants | Cameroon | 84.8 /100 | #141 | Excellent 64.7% |
| Pakistanis | 84.0 /100 | #142 | Excellent 64.7% |
| Czechoslovakians | 82.1 /100 | #143 | Excellent 64.6% |
| South American Indians | 81.9 /100 | #144 | Excellent 64.6% |
| Welsh | 80.1 /100 | #145 | Excellent 64.6% |
| Immigrants | Romania | 77.0 /100 | #146 | Good 64.6% |
| Immigrants | Chile | 76.5 /100 | #147 | Good 64.6% |
| Delaware | 76.3 /100 | #148 | Good 64.6% |
| Sioux | 76.3 /100 | #149 | Good 64.6% |
| Romanians | 75.3 /100 | #150 | Good 64.5% |
| Syrians | 75.2 /100 | #151 | Good 64.5% |
| Scottish | 70.9 /100 | #152 | Good 64.5% |
| Swedes | 69.8 /100 | #153 | Good 64.5% |