Yaqui vs Immigrants from Uzbekistan Family Households
COMPARE
Yaqui
Immigrants from Uzbekistan
Family Households
Family Households Comparison
Yaqui
Immigrants from Uzbekistan
65.6%
FAMILY HOUSEHOLDS
99.8/ 100
METRIC RATING
78th/ 347
METRIC RANK
63.4%
FAMILY HOUSEHOLDS
1.5/ 100
METRIC RATING
247th/ 347
METRIC RANK
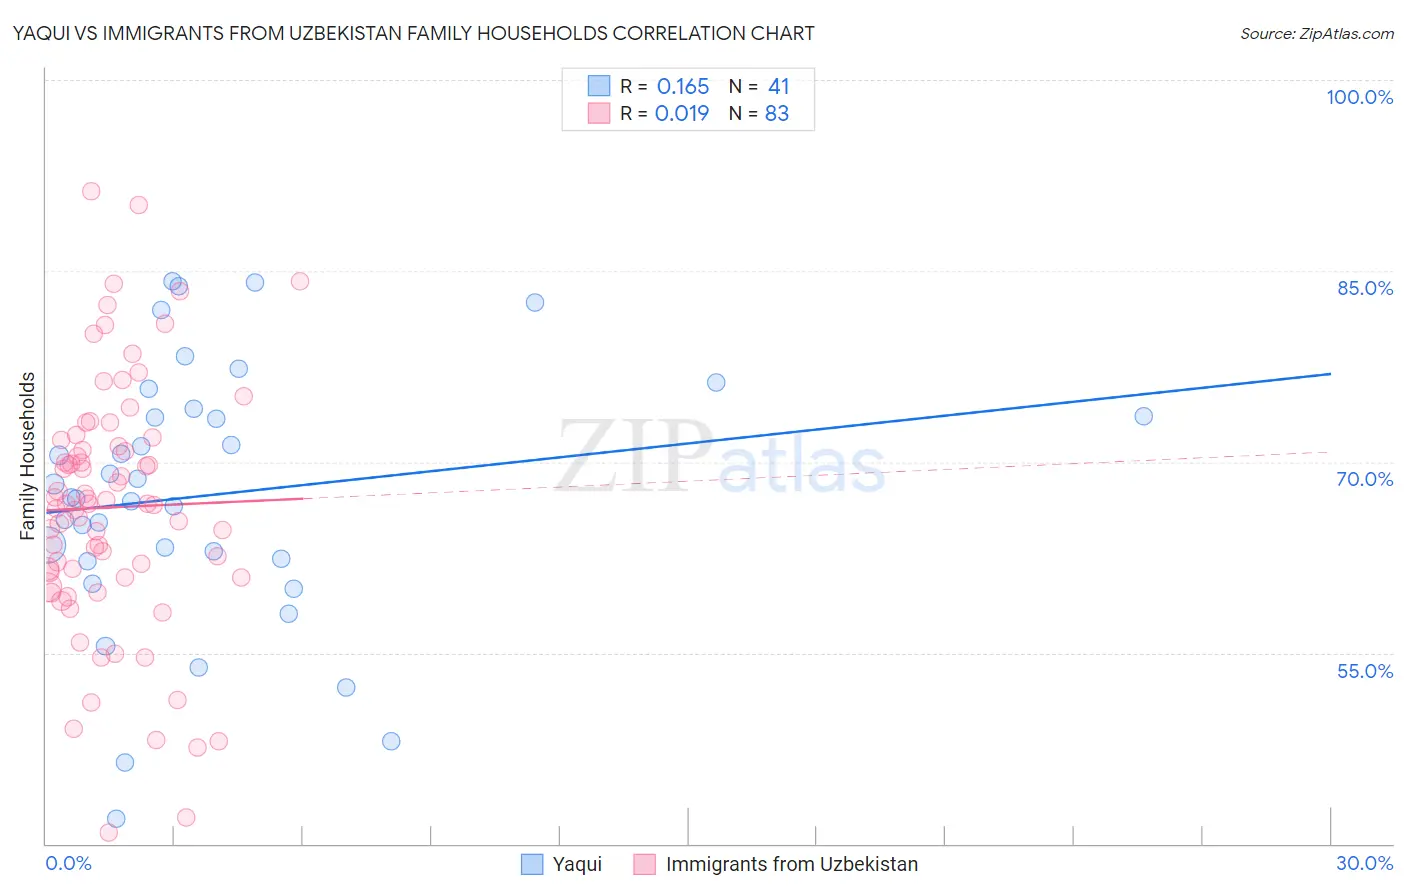
Yaqui vs Immigrants from Uzbekistan Family Households Correlation Chart
The statistical analysis conducted on geographies consisting of 107,720,236 people shows a poor positive correlation between the proportion of Yaqui and percentage of family households in the United States with a correlation coefficient (R) of 0.165 and weighted average of 65.6%. Similarly, the statistical analysis conducted on geographies consisting of 118,723,370 people shows no correlation between the proportion of Immigrants from Uzbekistan and percentage of family households in the United States with a correlation coefficient (R) of 0.019 and weighted average of 63.4%, a difference of 3.5%.
Family Households Correlation Summary
| Measurement | Yaqui | Immigrants from Uzbekistan |
| Minimum | 41.9% | 40.8% |
| Maximum | 84.2% | 91.2% |
| Range | 42.3% | 50.4% |
| Mean | 67.4% | 66.4% |
| Median | 67.2% | 66.7% |
| Interquartile 25% (IQ1) | 62.3% | 60.9% |
| Interquartile 75% (IQ3) | 73.9% | 71.7% |
| Interquartile Range (IQR) | 11.6% | 10.8% |
| Standard Deviation (Sample) | 10.2% | 9.9% |
| Standard Deviation (Population) | 10.1% | 9.9% |
Similar Demographics by Family Households
Demographics Similar to Yaqui by Family Households
In terms of family households, the demographic groups most similar to Yaqui are Immigrants from South America (65.6%, a difference of 0.0%), Immigrants from the Azores (65.6%, a difference of 0.010%), Immigrants from Costa Rica (65.6%, a difference of 0.030%), Puget Sound Salish (65.6%, a difference of 0.050%), and Houma (65.7%, a difference of 0.12%).
| Demographics | Rating | Rank | Family Households |
| Bhutanese | 99.9 /100 | #71 | Exceptional 65.9% |
| Portuguese | 99.9 /100 | #72 | Exceptional 65.8% |
| Laotians | 99.9 /100 | #73 | Exceptional 65.8% |
| Burmese | 99.9 /100 | #74 | Exceptional 65.7% |
| Houma | 99.9 /100 | #75 | Exceptional 65.7% |
| Immigrants | Azores | 99.8 /100 | #76 | Exceptional 65.6% |
| Immigrants | South America | 99.8 /100 | #77 | Exceptional 65.6% |
| Yaqui | 99.8 /100 | #78 | Exceptional 65.6% |
| Immigrants | Costa Rica | 99.8 /100 | #79 | Exceptional 65.6% |
| Puget Sound Salish | 99.8 /100 | #80 | Exceptional 65.6% |
| Jordanians | 99.7 /100 | #81 | Exceptional 65.5% |
| Immigrants | Lebanon | 99.7 /100 | #82 | Exceptional 65.5% |
| Immigrants | Guyana | 99.6 /100 | #83 | Exceptional 65.5% |
| Americans | 99.6 /100 | #84 | Exceptional 65.5% |
| Immigrants | Cambodia | 99.5 /100 | #85 | Exceptional 65.4% |
Demographics Similar to Immigrants from Uzbekistan by Family Households
In terms of family households, the demographic groups most similar to Immigrants from Uzbekistan are Immigrants from Ghana (63.4%, a difference of 0.010%), Dominican (63.4%, a difference of 0.010%), Russian (63.4%, a difference of 0.020%), Eastern European (63.4%, a difference of 0.030%), and Immigrants from Dominica (63.4%, a difference of 0.030%).
| Demographics | Rating | Rank | Family Households |
| South Africans | 1.9 /100 | #240 | Tragic 63.4% |
| Immigrants | St. Vincent and the Grenadines | 1.9 /100 | #241 | Tragic 63.4% |
| Immigrants | Israel | 1.8 /100 | #242 | Tragic 63.4% |
| Immigrants | Czechoslovakia | 1.8 /100 | #243 | Tragic 63.4% |
| Eastern Europeans | 1.6 /100 | #244 | Tragic 63.4% |
| Immigrants | Dominica | 1.6 /100 | #245 | Tragic 63.4% |
| Immigrants | Ghana | 1.6 /100 | #246 | Tragic 63.4% |
| Immigrants | Uzbekistan | 1.5 /100 | #247 | Tragic 63.4% |
| Dominicans | 1.5 /100 | #248 | Tragic 63.4% |
| Russians | 1.4 /100 | #249 | Tragic 63.4% |
| Immigrants | Japan | 1.4 /100 | #250 | Tragic 63.4% |
| Taiwanese | 1.2 /100 | #251 | Tragic 63.3% |
| Bahamians | 1.1 /100 | #252 | Tragic 63.3% |
| Immigrants | Dominican Republic | 1.0 /100 | #253 | Tragic 63.3% |
| Slovaks | 1.0 /100 | #254 | Tragic 63.3% |