U.S. Virgin Islander vs Bahamian Divorced or Separated
COMPARE
U.S. Virgin Islander
Bahamian
Divorced or Separated
Divorced or Separated Comparison
U.S. Virgin Islanders
Bahamians
13.4%
DIVORCED OR SEPARATED
0.0/ 100
METRIC RATING
323rd/ 347
METRIC RANK
14.2%
DIVORCED OR SEPARATED
0.0/ 100
METRIC RATING
341st/ 347
METRIC RANK
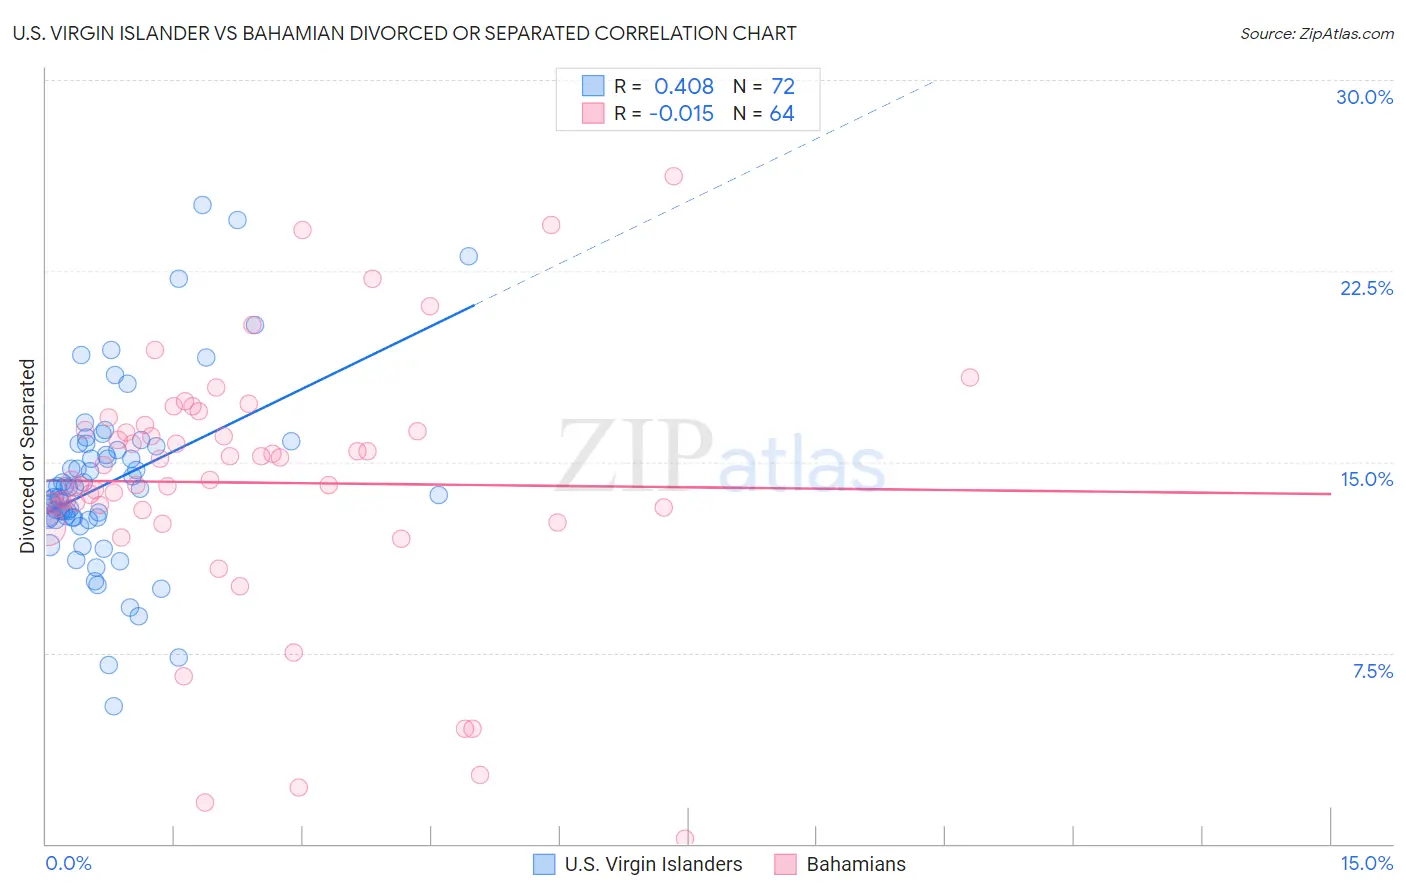
U.S. Virgin Islander vs Bahamian Divorced or Separated Correlation Chart
The statistical analysis conducted on geographies consisting of 87,523,386 people shows a moderate positive correlation between the proportion of U.S. Virgin Islanders and percentage of population currently divorced or separated in the United States with a correlation coefficient (R) of 0.408 and weighted average of 13.4%. Similarly, the statistical analysis conducted on geographies consisting of 112,659,995 people shows no correlation between the proportion of Bahamians and percentage of population currently divorced or separated in the United States with a correlation coefficient (R) of -0.015 and weighted average of 14.2%, a difference of 5.9%.
Divorced or Separated Correlation Summary
| Measurement | U.S. Virgin Islander | Bahamian |
| Minimum | 5.4% | 0.20% |
| Maximum | 25.1% | 26.2% |
| Range | 19.7% | 26.0% |
| Mean | 14.2% | 14.2% |
| Median | 14.0% | 14.6% |
| Interquartile 25% (IQ1) | 12.8% | 13.1% |
| Interquartile 75% (IQ3) | 15.7% | 16.4% |
| Interquartile Range (IQR) | 2.9% | 3.2% |
| Standard Deviation (Sample) | 3.6% | 5.1% |
| Standard Deviation (Population) | 3.5% | 5.0% |
Demographics Similar to U.S. Virgin Islanders and Bahamians by Divorced or Separated
In terms of divorced or separated, the demographic groups most similar to U.S. Virgin Islanders are Osage (13.4%, a difference of 0.070%), Potawatomi (13.5%, a difference of 0.13%), Immigrants from Congo (13.5%, a difference of 0.14%), Immigrants from Haiti (13.4%, a difference of 0.22%), and Comanche (13.5%, a difference of 0.63%). Similarly, the demographic groups most similar to Bahamians are Seminole (14.3%, a difference of 0.17%), Chickasaw (14.2%, a difference of 0.20%), Colville (14.2%, a difference of 0.24%), Choctaw (14.1%, a difference of 0.77%), and Crow (14.1%, a difference of 1.1%).
| Demographics | Rating | Rank | Divorced or Separated |
| Immigrants | Haiti | 0.0 /100 | #322 | Tragic 13.4% |
| U.S. Virgin Islanders | 0.0 /100 | #323 | Tragic 13.4% |
| Osage | 0.0 /100 | #324 | Tragic 13.4% |
| Potawatomi | 0.0 /100 | #325 | Tragic 13.5% |
| Immigrants | Congo | 0.0 /100 | #326 | Tragic 13.5% |
| Comanche | 0.0 /100 | #327 | Tragic 13.5% |
| Immigrants | Caribbean | 0.0 /100 | #328 | Tragic 13.6% |
| Houma | 0.0 /100 | #329 | Tragic 13.6% |
| Paiute | 0.0 /100 | #330 | Tragic 13.6% |
| Blacks/African Americans | 0.0 /100 | #331 | Tragic 13.6% |
| Cherokee | 0.0 /100 | #332 | Tragic 13.7% |
| Puerto Ricans | 0.0 /100 | #333 | Tragic 13.9% |
| Immigrants | Bahamas | 0.0 /100 | #334 | Tragic 13.9% |
| Dutch West Indians | 0.0 /100 | #335 | Tragic 14.0% |
| Shoshone | 0.0 /100 | #336 | Tragic 14.0% |
| Crow | 0.0 /100 | #337 | Tragic 14.1% |
| Choctaw | 0.0 /100 | #338 | Tragic 14.1% |
| Colville | 0.0 /100 | #339 | Tragic 14.2% |
| Chickasaw | 0.0 /100 | #340 | Tragic 14.2% |
| Bahamians | 0.0 /100 | #341 | Tragic 14.2% |
| Seminole | 0.0 /100 | #342 | Tragic 14.3% |