Albanian vs Bahamian Divorced or Separated
COMPARE
Albanian
Bahamian
Divorced or Separated
Divorced or Separated Comparison
Albanians
Bahamians
11.5%
DIVORCED OR SEPARATED
99.6/ 100
METRIC RATING
76th/ 347
METRIC RANK
14.2%
DIVORCED OR SEPARATED
0.0/ 100
METRIC RATING
341st/ 347
METRIC RANK
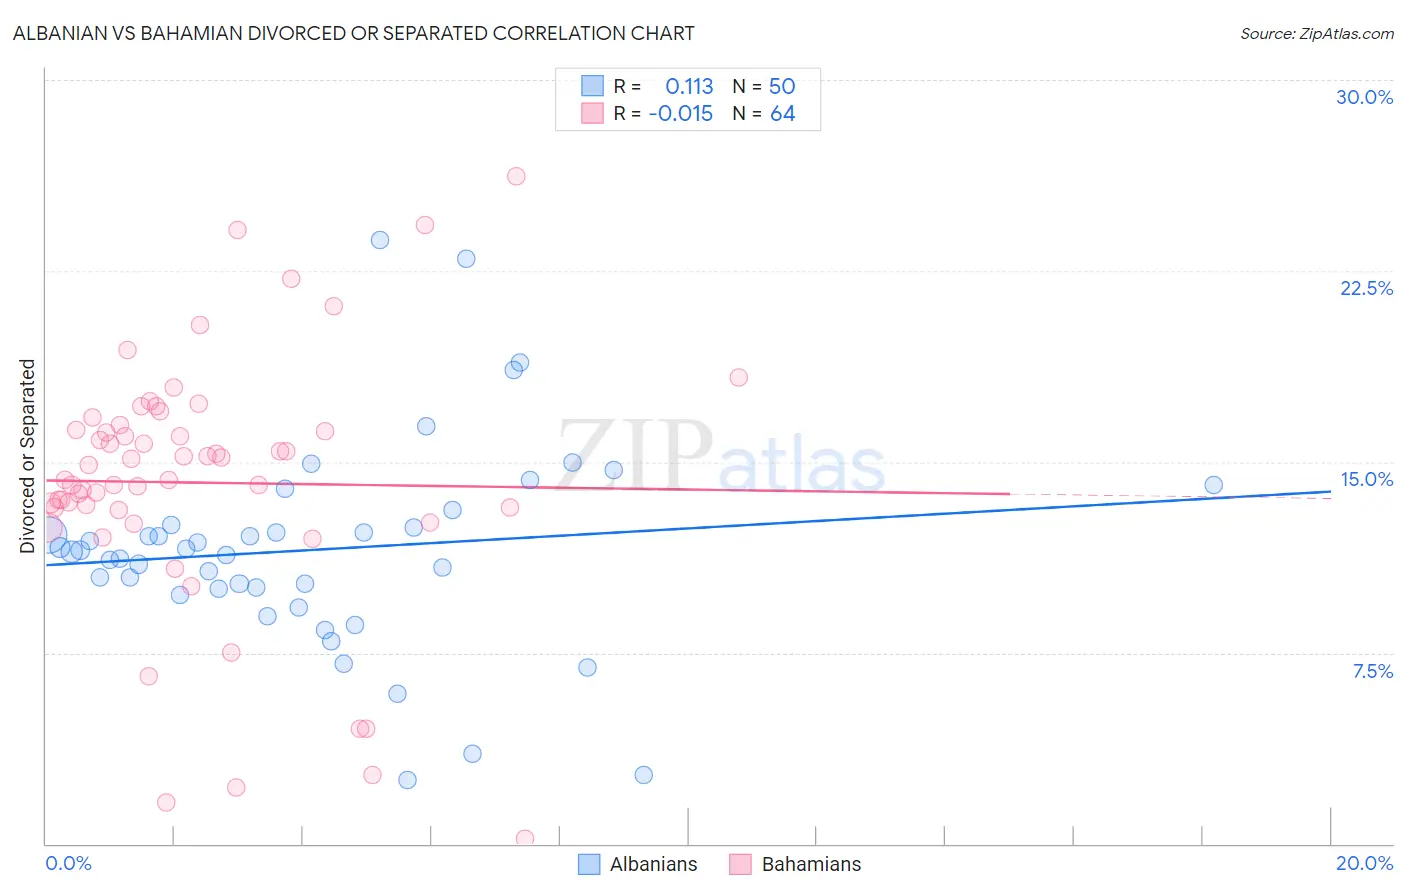
Albanian vs Bahamian Divorced or Separated Correlation Chart
The statistical analysis conducted on geographies consisting of 193,199,268 people shows a poor positive correlation between the proportion of Albanians and percentage of population currently divorced or separated in the United States with a correlation coefficient (R) of 0.113 and weighted average of 11.5%. Similarly, the statistical analysis conducted on geographies consisting of 112,659,995 people shows no correlation between the proportion of Bahamians and percentage of population currently divorced or separated in the United States with a correlation coefficient (R) of -0.015 and weighted average of 14.2%, a difference of 23.9%.
Divorced or Separated Correlation Summary
| Measurement | Albanian | Bahamian |
| Minimum | 2.5% | 0.20% |
| Maximum | 23.7% | 26.2% |
| Range | 21.2% | 26.0% |
| Mean | 11.6% | 14.2% |
| Median | 11.5% | 14.6% |
| Interquartile 25% (IQ1) | 10.0% | 13.1% |
| Interquartile 75% (IQ3) | 12.5% | 16.4% |
| Interquartile Range (IQR) | 2.5% | 3.2% |
| Standard Deviation (Sample) | 4.1% | 5.1% |
| Standard Deviation (Population) | 4.1% | 5.0% |
Similar Demographics by Divorced or Separated
Demographics Similar to Albanians by Divorced or Separated
In terms of divorced or separated, the demographic groups most similar to Albanians are Immigrants from Northern Africa (11.5%, a difference of 0.020%), Taiwanese (11.5%, a difference of 0.10%), Immigrants from Italy (11.5%, a difference of 0.11%), Jordanian (11.5%, a difference of 0.16%), and Immigrants from North Macedonia (11.5%, a difference of 0.16%).
| Demographics | Rating | Rank | Divorced or Separated |
| Immigrants | Belgium | 99.7 /100 | #69 | Exceptional 11.5% |
| Immigrants | Eastern Europe | 99.7 /100 | #70 | Exceptional 11.5% |
| Paraguayans | 99.7 /100 | #71 | Exceptional 11.5% |
| Jordanians | 99.6 /100 | #72 | Exceptional 11.5% |
| Immigrants | North Macedonia | 99.6 /100 | #73 | Exceptional 11.5% |
| Taiwanese | 99.6 /100 | #74 | Exceptional 11.5% |
| Immigrants | Northern Africa | 99.6 /100 | #75 | Exceptional 11.5% |
| Albanians | 99.6 /100 | #76 | Exceptional 11.5% |
| Immigrants | Italy | 99.5 /100 | #77 | Exceptional 11.5% |
| Afghans | 99.4 /100 | #78 | Exceptional 11.5% |
| Guyanese | 99.4 /100 | #79 | Exceptional 11.5% |
| Immigrants | Switzerland | 99.4 /100 | #80 | Exceptional 11.5% |
| Russians | 99.4 /100 | #81 | Exceptional 11.5% |
| Immigrants | Romania | 99.3 /100 | #82 | Exceptional 11.5% |
| Immigrants | Bulgaria | 99.3 /100 | #83 | Exceptional 11.5% |
Demographics Similar to Bahamians by Divorced or Separated
In terms of divorced or separated, the demographic groups most similar to Bahamians are Seminole (14.3%, a difference of 0.17%), Chickasaw (14.2%, a difference of 0.20%), Colville (14.2%, a difference of 0.24%), Choctaw (14.1%, a difference of 0.77%), and Crow (14.1%, a difference of 1.1%).
| Demographics | Rating | Rank | Divorced or Separated |
| Puerto Ricans | 0.0 /100 | #333 | Tragic 13.9% |
| Immigrants | Bahamas | 0.0 /100 | #334 | Tragic 13.9% |
| Dutch West Indians | 0.0 /100 | #335 | Tragic 14.0% |
| Shoshone | 0.0 /100 | #336 | Tragic 14.0% |
| Crow | 0.0 /100 | #337 | Tragic 14.1% |
| Choctaw | 0.0 /100 | #338 | Tragic 14.1% |
| Colville | 0.0 /100 | #339 | Tragic 14.2% |
| Chickasaw | 0.0 /100 | #340 | Tragic 14.2% |
| Bahamians | 0.0 /100 | #341 | Tragic 14.2% |
| Seminole | 0.0 /100 | #342 | Tragic 14.3% |
| Creek | 0.0 /100 | #343 | Tragic 14.4% |
| Cubans | 0.0 /100 | #344 | Tragic 14.5% |
| Kiowa | 0.0 /100 | #345 | Tragic 14.5% |
| Arapaho | 0.0 /100 | #346 | Tragic 14.8% |
| Immigrants | Cuba | 0.0 /100 | #347 | Tragic 15.2% |