Ugandan vs Immigrants from Eastern Africa Family Households with Children
COMPARE
Ugandan
Immigrants from Eastern Africa
Family Households with Children
Family Households with Children Comparison
Ugandans
Immigrants from Eastern Africa
27.4%
FAMILY HOUSEHOLDS WITH CHILDREN
49.2/ 100
METRIC RATING
177th/ 347
METRIC RANK
27.7%
FAMILY HOUSEHOLDS WITH CHILDREN
80.2/ 100
METRIC RATING
143rd/ 347
METRIC RANK
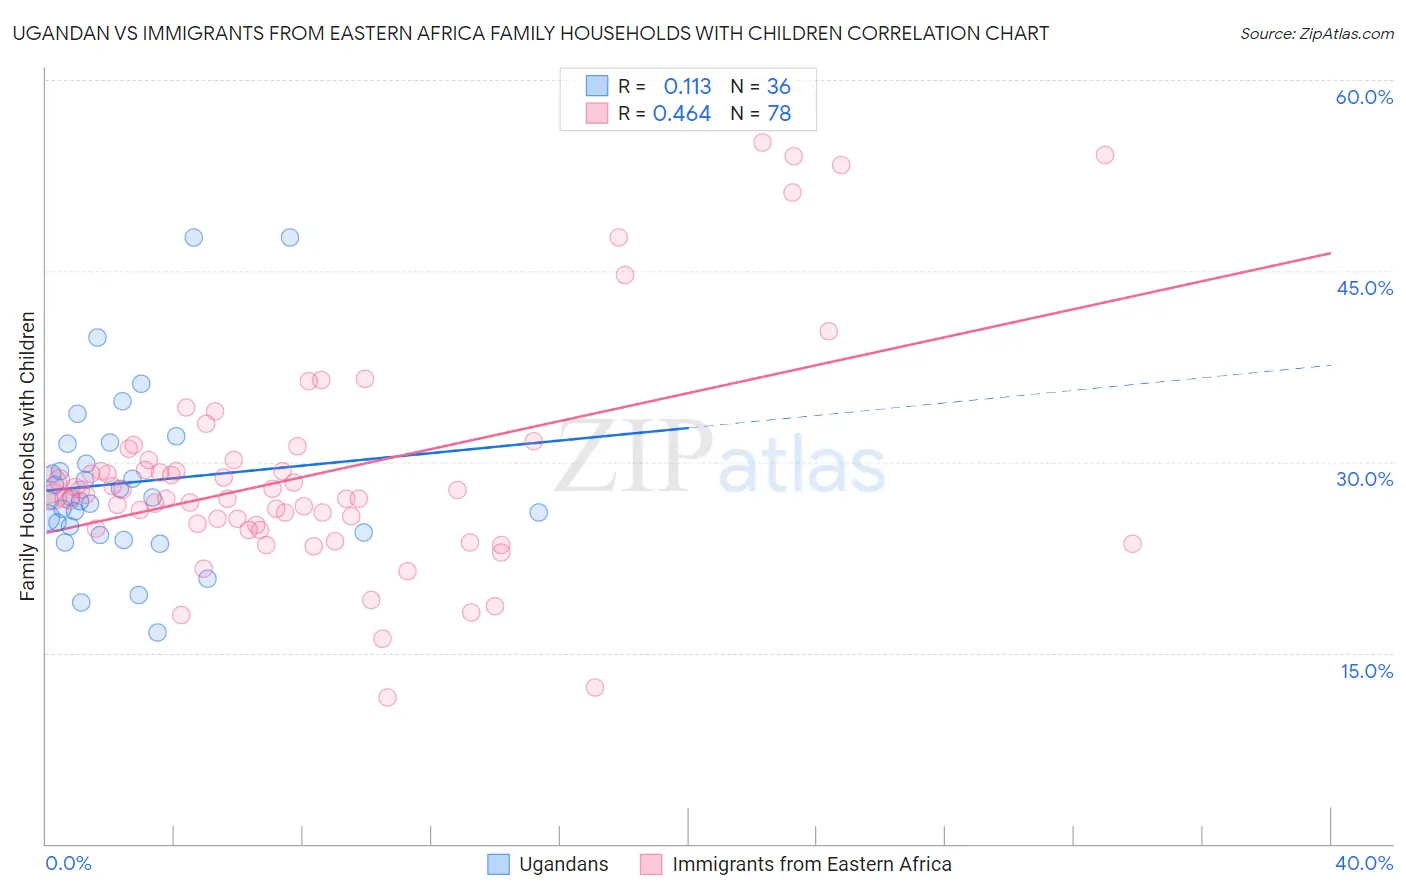
Ugandan vs Immigrants from Eastern Africa Family Households with Children Correlation Chart
The statistical analysis conducted on geographies consisting of 93,993,745 people shows a poor positive correlation between the proportion of Ugandans and percentage of family households with children in the United States with a correlation coefficient (R) of 0.113 and weighted average of 27.4%. Similarly, the statistical analysis conducted on geographies consisting of 354,810,617 people shows a moderate positive correlation between the proportion of Immigrants from Eastern Africa and percentage of family households with children in the United States with a correlation coefficient (R) of 0.464 and weighted average of 27.7%, a difference of 0.79%.
Family Households with Children Correlation Summary
| Measurement | Ugandan | Immigrants from Eastern Africa |
| Minimum | 16.6% | 11.5% |
| Maximum | 47.7% | 55.1% |
| Range | 31.1% | 43.6% |
| Mean | 28.4% | 29.0% |
| Median | 27.1% | 27.3% |
| Interquartile 25% (IQ1) | 24.7% | 25.0% |
| Interquartile 75% (IQ3) | 30.6% | 30.1% |
| Interquartile Range (IQR) | 5.9% | 5.1% |
| Standard Deviation (Sample) | 6.7% | 8.6% |
| Standard Deviation (Population) | 6.6% | 8.6% |
Similar Demographics by Family Households with Children
Demographics Similar to Ugandans by Family Households with Children
In terms of family households with children, the demographic groups most similar to Ugandans are Immigrants from China (27.4%, a difference of 0.010%), Spanish American (27.4%, a difference of 0.010%), White/Caucasian (27.4%, a difference of 0.020%), British (27.4%, a difference of 0.020%), and Turkish (27.4%, a difference of 0.050%).
| Demographics | Rating | Rank | Family Households with Children |
| Cherokee | 56.7 /100 | #170 | Average 27.5% |
| Blackfeet | 54.3 /100 | #171 | Average 27.5% |
| Israelis | 53.9 /100 | #172 | Average 27.5% |
| Immigrants | Argentina | 52.2 /100 | #173 | Average 27.5% |
| Whites/Caucasians | 50.0 /100 | #174 | Average 27.4% |
| British | 49.9 /100 | #175 | Average 27.4% |
| Immigrants | China | 49.6 /100 | #176 | Average 27.4% |
| Ugandans | 49.2 /100 | #177 | Average 27.4% |
| Spanish Americans | 48.9 /100 | #178 | Average 27.4% |
| Turks | 46.9 /100 | #179 | Average 27.4% |
| Immigrants | Turkey | 46.9 /100 | #180 | Average 27.4% |
| Aleuts | 46.7 /100 | #181 | Average 27.4% |
| Puget Sound Salish | 46.2 /100 | #182 | Average 27.4% |
| South Africans | 44.9 /100 | #183 | Average 27.4% |
| Native Hawaiians | 44.6 /100 | #184 | Average 27.4% |
Demographics Similar to Immigrants from Eastern Africa by Family Households with Children
In terms of family households with children, the demographic groups most similar to Immigrants from Eastern Africa are Brazilian (27.7%, a difference of 0.020%), Immigrants from Chile (27.7%, a difference of 0.030%), Basque (27.7%, a difference of 0.030%), Swiss (27.7%, a difference of 0.040%), and Immigrants from Moldova (27.6%, a difference of 0.040%).
| Demographics | Rating | Rank | Family Households with Children |
| Immigrants | Portugal | 84.1 /100 | #136 | Excellent 27.7% |
| Immigrants | Dominican Republic | 83.9 /100 | #137 | Excellent 27.7% |
| Uruguayans | 83.2 /100 | #138 | Excellent 27.7% |
| Vietnamese | 82.6 /100 | #139 | Excellent 27.7% |
| Spanish | 81.8 /100 | #140 | Excellent 27.7% |
| Immigrants | Eastern Asia | 81.7 /100 | #141 | Excellent 27.7% |
| Swiss | 81.4 /100 | #142 | Excellent 27.7% |
| Immigrants | Eastern Africa | 80.2 /100 | #143 | Excellent 27.7% |
| Brazilians | 79.6 /100 | #144 | Good 27.7% |
| Immigrants | Chile | 79.5 /100 | #145 | Good 27.7% |
| Basques | 79.5 /100 | #146 | Good 27.7% |
| Immigrants | Moldova | 79.1 /100 | #147 | Good 27.6% |
| Osage | 79.0 /100 | #148 | Good 27.6% |
| Menominee | 78.9 /100 | #149 | Good 27.6% |
| Argentineans | 78.5 /100 | #150 | Good 27.6% |