Tsimshian vs Immigrants from Iraq Currently Married
COMPARE
Tsimshian
Immigrants from Iraq
Currently Married
Currently Married Comparison
Tsimshian
Immigrants from Iraq
47.7%
CURRENTLY MARRIED
92.4/ 100
METRIC RATING
108th/ 347
METRIC RANK
47.3%
CURRENTLY MARRIED
82.8/ 100
METRIC RATING
130th/ 347
METRIC RANK
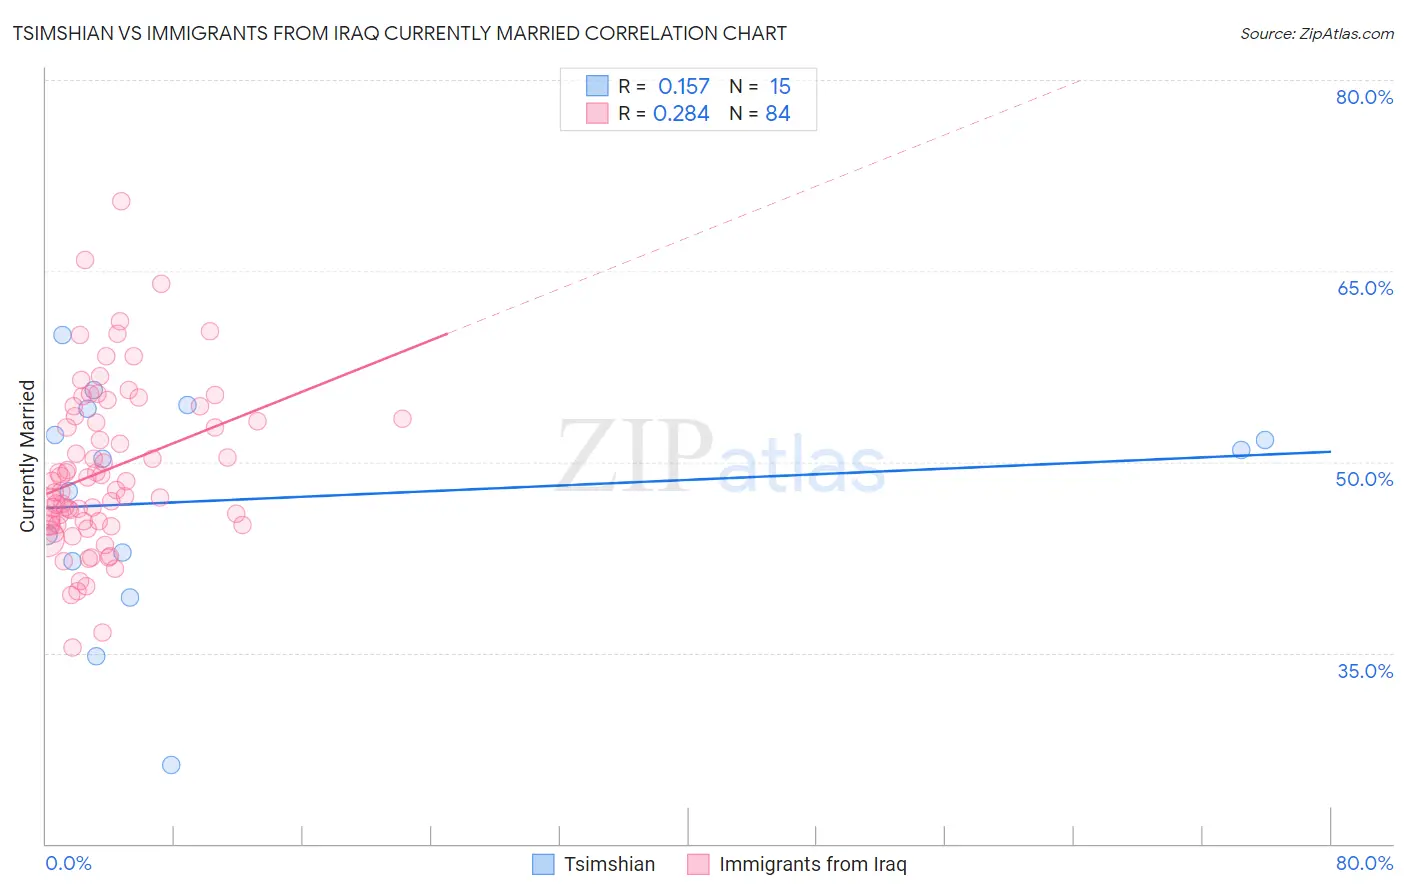
Tsimshian vs Immigrants from Iraq Currently Married Correlation Chart
The statistical analysis conducted on geographies consisting of 15,626,544 people shows a poor positive correlation between the proportion of Tsimshian and percentage of population currently married in the United States with a correlation coefficient (R) of 0.157 and weighted average of 47.7%. Similarly, the statistical analysis conducted on geographies consisting of 194,780,853 people shows a weak positive correlation between the proportion of Immigrants from Iraq and percentage of population currently married in the United States with a correlation coefficient (R) of 0.284 and weighted average of 47.3%, a difference of 0.83%.
Currently Married Correlation Summary
| Measurement | Tsimshian | Immigrants from Iraq |
| Minimum | 26.2% | 35.4% |
| Maximum | 60.0% | 70.5% |
| Range | 33.8% | 35.1% |
| Mean | 47.1% | 49.3% |
| Median | 50.2% | 48.1% |
| Interquartile 25% (IQ1) | 42.2% | 45.2% |
| Interquartile 75% (IQ3) | 54.2% | 53.5% |
| Interquartile Range (IQR) | 12.0% | 8.3% |
| Standard Deviation (Sample) | 8.9% | 6.5% |
| Standard Deviation (Population) | 8.6% | 6.4% |
Similar Demographics by Currently Married
Demographics Similar to Tsimshian by Currently Married
In terms of currently married, the demographic groups most similar to Tsimshian are Immigrants from Egypt (47.7%, a difference of 0.010%), Immigrants from Russia (47.7%, a difference of 0.050%), Immigrants from Italy (47.7%, a difference of 0.060%), Immigrants from Greece (47.7%, a difference of 0.090%), and Immigrants from Singapore (47.8%, a difference of 0.12%).
| Demographics | Rating | Rank | Currently Married |
| Immigrants | Germany | 94.1 /100 | #101 | Exceptional 47.8% |
| Turks | 93.9 /100 | #102 | Exceptional 47.8% |
| Cypriots | 93.7 /100 | #103 | Exceptional 47.8% |
| Serbians | 93.6 /100 | #104 | Exceptional 47.8% |
| Immigrants | Singapore | 93.3 /100 | #105 | Exceptional 47.8% |
| Immigrants | Greece | 93.1 /100 | #106 | Exceptional 47.7% |
| Immigrants | Italy | 92.9 /100 | #107 | Exceptional 47.7% |
| Tsimshian | 92.4 /100 | #108 | Exceptional 47.7% |
| Immigrants | Egypt | 92.3 /100 | #109 | Exceptional 47.7% |
| Immigrants | Russia | 92.0 /100 | #110 | Exceptional 47.7% |
| Immigrants | Hungary | 91.2 /100 | #111 | Exceptional 47.6% |
| Immigrants | Western Europe | 91.1 /100 | #112 | Exceptional 47.6% |
| Immigrants | Denmark | 90.9 /100 | #113 | Exceptional 47.6% |
| South Africans | 90.5 /100 | #114 | Exceptional 47.6% |
| Immigrants | Indonesia | 90.5 /100 | #115 | Exceptional 47.6% |
Demographics Similar to Immigrants from Iraq by Currently Married
In terms of currently married, the demographic groups most similar to Immigrants from Iraq are Icelander (47.3%, a difference of 0.020%), Sri Lankan (47.3%, a difference of 0.030%), Afghan (47.3%, a difference of 0.060%), Portuguese (47.3%, a difference of 0.090%), and Immigrants from Malaysia (47.3%, a difference of 0.10%).
| Demographics | Rating | Rank | Currently Married |
| Immigrants | Kazakhstan | 87.2 /100 | #123 | Excellent 47.4% |
| Laotians | 86.6 /100 | #124 | Excellent 47.4% |
| Okinawans | 85.3 /100 | #125 | Excellent 47.4% |
| Immigrants | Jordan | 84.9 /100 | #126 | Excellent 47.4% |
| New Zealanders | 84.9 /100 | #127 | Excellent 47.4% |
| Portuguese | 84.2 /100 | #128 | Excellent 47.3% |
| Sri Lankans | 83.2 /100 | #129 | Excellent 47.3% |
| Immigrants | Iraq | 82.8 /100 | #130 | Excellent 47.3% |
| Icelanders | 82.4 /100 | #131 | Excellent 47.3% |
| Afghans | 81.8 /100 | #132 | Excellent 47.3% |
| Immigrants | Malaysia | 81.1 /100 | #133 | Excellent 47.3% |
| Immigrants | Australia | 81.1 /100 | #134 | Excellent 47.3% |
| Immigrants | Norway | 79.7 /100 | #135 | Good 47.2% |
| Immigrants | Vietnam | 78.2 /100 | #136 | Good 47.2% |
| Paraguayans | 77.8 /100 | #137 | Good 47.2% |