Tsimshian vs Immigrants from Fiji Currently Married
COMPARE
Tsimshian
Immigrants from Fiji
Currently Married
Currently Married Comparison
Tsimshian
Immigrants from Fiji
47.7%
CURRENTLY MARRIED
92.4/ 100
METRIC RATING
108th/ 347
METRIC RANK
46.2%
CURRENTLY MARRIED
25.0/ 100
METRIC RATING
193rd/ 347
METRIC RANK
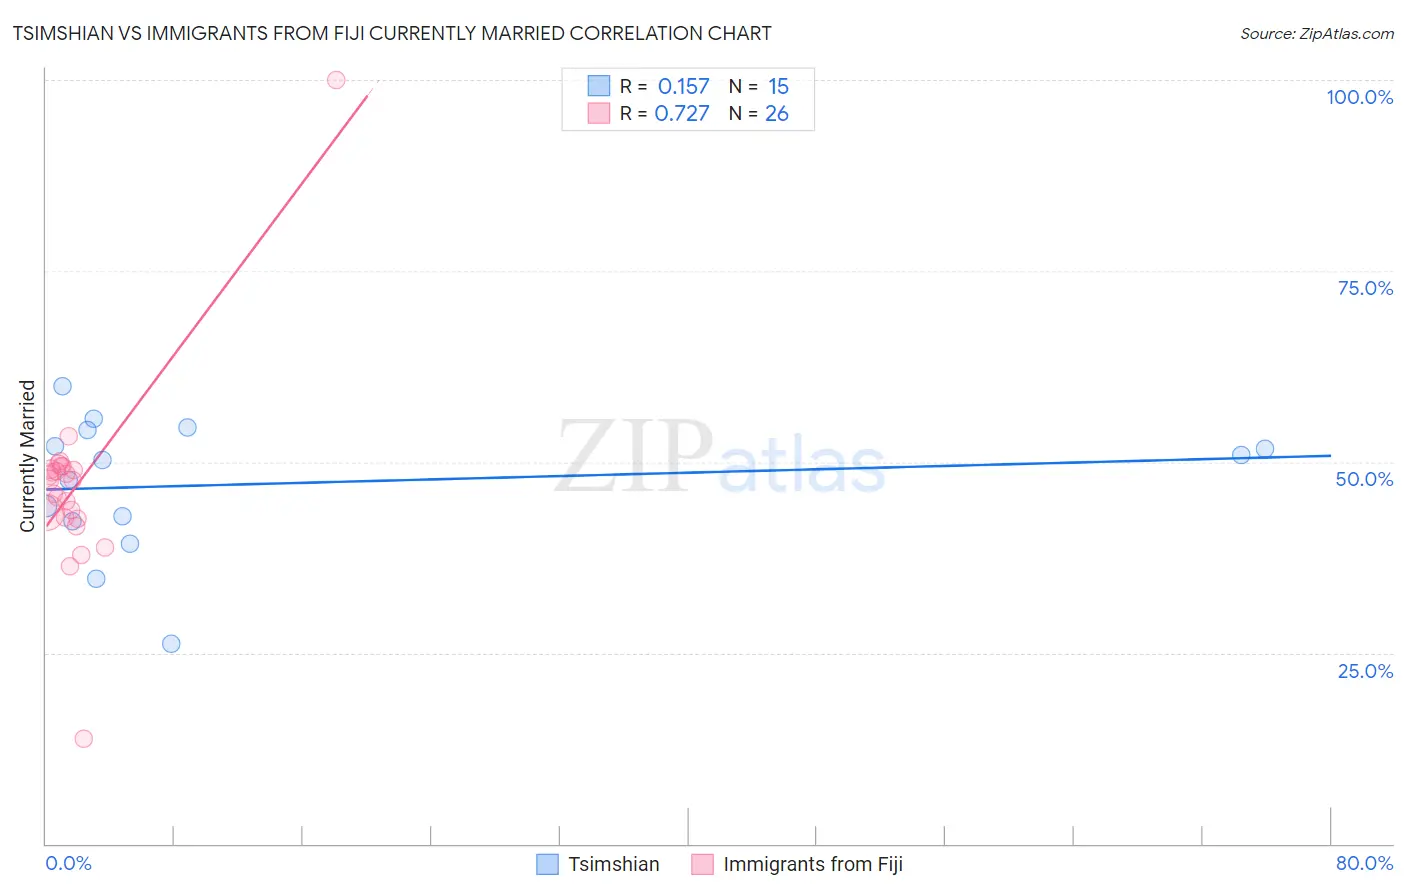
Tsimshian vs Immigrants from Fiji Currently Married Correlation Chart
The statistical analysis conducted on geographies consisting of 15,626,544 people shows a poor positive correlation between the proportion of Tsimshian and percentage of population currently married in the United States with a correlation coefficient (R) of 0.157 and weighted average of 47.7%. Similarly, the statistical analysis conducted on geographies consisting of 93,756,204 people shows a strong positive correlation between the proportion of Immigrants from Fiji and percentage of population currently married in the United States with a correlation coefficient (R) of 0.727 and weighted average of 46.2%, a difference of 3.3%.
Currently Married Correlation Summary
| Measurement | Tsimshian | Immigrants from Fiji |
| Minimum | 26.2% | 13.7% |
| Maximum | 60.0% | 100.0% |
| Range | 33.8% | 86.3% |
| Mean | 47.1% | 46.8% |
| Median | 50.2% | 47.6% |
| Interquartile 25% (IQ1) | 42.2% | 42.7% |
| Interquartile 75% (IQ3) | 54.2% | 49.1% |
| Interquartile Range (IQR) | 12.0% | 6.4% |
| Standard Deviation (Sample) | 8.9% | 13.2% |
| Standard Deviation (Population) | 8.6% | 13.0% |
Similar Demographics by Currently Married
Demographics Similar to Tsimshian by Currently Married
In terms of currently married, the demographic groups most similar to Tsimshian are Immigrants from Egypt (47.7%, a difference of 0.010%), Immigrants from Russia (47.7%, a difference of 0.050%), Immigrants from Italy (47.7%, a difference of 0.060%), Immigrants from Greece (47.7%, a difference of 0.090%), and Immigrants from Singapore (47.8%, a difference of 0.12%).
| Demographics | Rating | Rank | Currently Married |
| Immigrants | Germany | 94.1 /100 | #101 | Exceptional 47.8% |
| Turks | 93.9 /100 | #102 | Exceptional 47.8% |
| Cypriots | 93.7 /100 | #103 | Exceptional 47.8% |
| Serbians | 93.6 /100 | #104 | Exceptional 47.8% |
| Immigrants | Singapore | 93.3 /100 | #105 | Exceptional 47.8% |
| Immigrants | Greece | 93.1 /100 | #106 | Exceptional 47.7% |
| Immigrants | Italy | 92.9 /100 | #107 | Exceptional 47.7% |
| Tsimshian | 92.4 /100 | #108 | Exceptional 47.7% |
| Immigrants | Egypt | 92.3 /100 | #109 | Exceptional 47.7% |
| Immigrants | Russia | 92.0 /100 | #110 | Exceptional 47.7% |
| Immigrants | Hungary | 91.2 /100 | #111 | Exceptional 47.6% |
| Immigrants | Western Europe | 91.1 /100 | #112 | Exceptional 47.6% |
| Immigrants | Denmark | 90.9 /100 | #113 | Exceptional 47.6% |
| South Africans | 90.5 /100 | #114 | Exceptional 47.6% |
| Immigrants | Indonesia | 90.5 /100 | #115 | Exceptional 47.6% |
Demographics Similar to Immigrants from Fiji by Currently Married
In terms of currently married, the demographic groups most similar to Immigrants from Fiji are Soviet Union (46.2%, a difference of 0.040%), South American (46.1%, a difference of 0.060%), Immigrants from Nepal (46.1%, a difference of 0.070%), Immigrants from France (46.2%, a difference of 0.13%), and Immigrants from Bosnia and Herzegovina (46.1%, a difference of 0.14%).
| Demographics | Rating | Rank | Currently Married |
| Immigrants | Chile | 36.8 /100 | #186 | Fair 46.4% |
| Immigrants | Peru | 35.3 /100 | #187 | Fair 46.4% |
| Colombians | 31.8 /100 | #188 | Fair 46.3% |
| Fijians | 30.3 /100 | #189 | Fair 46.3% |
| Choctaw | 29.1 /100 | #190 | Fair 46.3% |
| Immigrants | France | 27.7 /100 | #191 | Fair 46.2% |
| Soviet Union | 25.7 /100 | #192 | Fair 46.2% |
| Immigrants | Fiji | 25.0 /100 | #193 | Fair 46.2% |
| South Americans | 23.8 /100 | #194 | Fair 46.1% |
| Immigrants | Nepal | 23.7 /100 | #195 | Fair 46.1% |
| Immigrants | Bosnia and Herzegovina | 22.2 /100 | #196 | Fair 46.1% |
| Immigrants | Kuwait | 21.7 /100 | #197 | Fair 46.1% |
| Immigrants | Colombia | 21.0 /100 | #198 | Fair 46.1% |
| Immigrants | Costa Rica | 19.6 /100 | #199 | Poor 46.0% |
| Creek | 17.2 /100 | #200 | Poor 46.0% |