Tsimshian vs Immigrants from Ethiopia Currently Married

COMPARE

Tsimshian
Race
Ancestry
AfghanAfricanAlaska NativeAlaskan AthabascanAlbanianAleutAlsatianAmericanApacheArabArapahoArgentineanArmenianAssyrian/Chaldean/SyriacAustralianAustrianBahamianBangladeshiBarbadianBasqueBelgianBelizeanBermudanBhutaneseBlackfeetBolivianBrazilianBritishBritish West IndianBulgarianBurmeseCajunCambodianCanadianCape VerdeanCarpatho RusynCelticCentral AmericanCentral American IndianCherokeeCheyenneChickasawChileanChineseChippewaChoctawColombianColvilleComancheCosta RicanCreeCreekCroatianCrowCubanCypriotCzechCzechoslovakianDanishDelawareDominicanDutchDutch West IndianEastern EuropeanEcuadorianEgyptianEnglishEstonianEthiopianEuropeanFijianFilipinoFinnishFrenchFrench American IndianFrench CanadianGermanGerman RussianGhanaianGreekGuamanian/ChamorroGuatemalanGuyaneseHaitianHmongHonduranHopiHoumaHungarianIcelanderIndian (Asian)IndonesianInupiatIranianIraqiIrishIroquoisIsraeliItalianJamaicanJapaneseJordanianKenyanKiowaKoreanLaotianLatvianLebaneseLiberianLithuanianLumbeeLuxembourgerMacedonianMalaysianMalteseMarshalleseMenomineeMexicanMexican American IndianMongolianMoroccanNative HawaiianNavajoNepaleseNew ZealanderNicaraguanNigerianNorthern EuropeanNorwegianOkinawanOsageOttawaPaiutePakistaniPalestinianPanamanianParaguayanPennsylvania GermanPeruvianPimaPolishPortuguesePotawatomiPuebloPuerto RicanPuget Sound SalishRomanianRussianSalvadoranSamoanScandinavianScotch-IrishScottishSeminoleSenegaleseSerbianShoshoneSierra LeoneanSiouxSlavicSlovakSloveneSomaliSouth AfricanSouth AmericanSouth American IndianSoviet UnionSpaniardSpanishSpanish AmericanSpanish American IndianSri LankanSubsaharan AfricanSudaneseSwedishSwissSyrianTaiwaneseThaiTlingit-HaidaTohono O'OdhamTonganTrinidadian and TobagonianTsimshianTurkishU.S. Virgin IslanderUgandanUkrainianUruguayanUteVenezuelanVietnameseWelshWest IndianYakamaYaquiYugoslavianYumanYup'ikZimbabwean
Immigration
NonimmigrantsImmigrantsAfghanistanAfricaAlbaniaArgentinaArmeniaAsiaAustraliaAustriaBahamasBangladeshBarbadosBelarusBelgiumBelizeBoliviaBosnia and HerzegovinaBrazilBulgariaBurma/MyanmarCabo VerdeCambodiaCameroonCanadaCaribbeanCentral AmericaChileChinaColombiaCongoCosta RicaCroatiaCubaCzechoslovakiaDenmarkDominicaDominican RepublicEastern AfricaEastern AsiaEastern EuropeEcuadorEgyptEl SalvadorEnglandEritreaEuropeFijiFranceGermanyGhanaGreeceGrenadaGuatemalaGuyanaHaitiHondurasHong KongHungaryIndiaIndonesiaIranIraqIrelandIsraelItalyJamaicaJapanJordanKazakhstanKenyaKoreaKuwaitLaosLatin AmericaLatviaLebanonLiberiaLithuaniaMalaysiaMexicoMicronesiaMiddle AfricaMoldovaMoroccoNepalNetherlandsNicaraguaNigeriaNorth AmericaNorth MacedoniaNorthern AfricaNorthern EuropeNorwayOceaniaPakistanPanamaPeruPhilippinesPolandPortugalRomaniaRussiaSaudi ArabiaScotlandSenegalSerbiaSierra LeoneSingaporeSomaliaSouth AfricaSouth AmericaSouth Central AsiaSouth Eastern AsiaSouthern EuropeSpainSri LankaSt. Vincent and the GrenadinesSudanSwedenSwitzerlandSyriaTaiwanThailandTrinidad and TobagoTurkeyUgandaUkraineUruguayUzbekistanVenezuelaVietnamWest IndiesWestern AfricaWestern AsiaWestern EuropeYemenZaireZimbabweAzores
Immigrants from Ethiopia
Race
Ancestry
AfghanAfricanAlaska NativeAlaskan AthabascanAlbanianAleutAlsatianAmericanApacheArabArapahoArgentineanArmenianAssyrian/Chaldean/SyriacAustralianAustrianBahamianBangladeshiBarbadianBasqueBelgianBelizeanBermudanBhutaneseBlackfeetBolivianBrazilianBritishBritish West IndianBulgarianBurmeseCajunCambodianCanadianCape VerdeanCarpatho RusynCelticCentral AmericanCentral American IndianCherokeeCheyenneChickasawChileanChineseChippewaChoctawColombianColvilleComancheCosta RicanCreeCreekCroatianCrowCubanCypriotCzechCzechoslovakianDanishDelawareDominicanDutchDutch West IndianEastern EuropeanEcuadorianEgyptianEnglishEstonianEthiopianEuropeanFijianFilipinoFinnishFrenchFrench American IndianFrench CanadianGermanGerman RussianGhanaianGreekGuamanian/ChamorroGuatemalanGuyaneseHaitianHmongHonduranHopiHoumaHungarianIcelanderIndian (Asian)IndonesianInupiatIranianIraqiIrishIroquoisIsraeliItalianJamaicanJapaneseJordanianKenyanKiowaKoreanLaotianLatvianLebaneseLiberianLithuanianLumbeeLuxembourgerMacedonianMalaysianMalteseMarshalleseMenomineeMexicanMexican American IndianMongolianMoroccanNative HawaiianNavajoNepaleseNew ZealanderNicaraguanNigerianNorthern EuropeanNorwegianOkinawanOsageOttawaPaiutePakistaniPalestinianPanamanianParaguayanPennsylvania GermanPeruvianPimaPolishPortuguesePotawatomiPuebloPuerto RicanPuget Sound SalishRomanianRussianSalvadoranSamoanScandinavianScotch-IrishScottishSeminoleSenegaleseSerbianShoshoneSierra LeoneanSiouxSlavicSlovakSloveneSomaliSouth AfricanSouth AmericanSouth American IndianSoviet UnionSpaniardSpanishSpanish AmericanSpanish American IndianSri LankanSubsaharan AfricanSudaneseSwedishSwissSyrianTaiwaneseThaiTlingit-HaidaTohono O'OdhamTonganTrinidadian and TobagonianTurkishU.S. Virgin IslanderUgandanUkrainianUruguayanUteVenezuelanVietnameseWelshWest IndianYakamaYaquiYugoslavianYumanYup'ikZimbabwean
Immigration
NonimmigrantsImmigrantsAfghanistanAfricaAlbaniaArgentinaArmeniaAsiaAustraliaAustriaBahamasBangladeshBarbadosBelarusBelgiumBelizeBoliviaBosnia and HerzegovinaBrazilBulgariaBurma/MyanmarCabo VerdeCambodiaCameroonCanadaCaribbeanCentral AmericaChileChinaColombiaCongoCosta RicaCroatiaCubaCzechoslovakiaDenmarkDominicaDominican RepublicEastern AfricaEastern AsiaEastern EuropeEcuadorEgyptEl SalvadorEnglandEritreaEthiopiaEuropeFijiFranceGermanyGhanaGreeceGrenadaGuatemalaGuyanaHaitiHondurasHong KongHungaryIndiaIndonesiaIranIraqIrelandIsraelItalyJamaicaJapanJordanKazakhstanKenyaKoreaKuwaitLaosLatin AmericaLatviaLebanonLiberiaLithuaniaMalaysiaMexicoMicronesiaMiddle AfricaMoldovaMoroccoNepalNetherlandsNicaraguaNigeriaNorth AmericaNorth MacedoniaNorthern AfricaNorthern EuropeNorwayOceaniaPakistanPanamaPeruPhilippinesPolandPortugalRomaniaRussiaSaudi ArabiaScotlandSenegalSerbiaSierra LeoneSingaporeSomaliaSouth AfricaSouth AmericaSouth Central AsiaSouth Eastern AsiaSouthern EuropeSpainSri LankaSt. Vincent and the GrenadinesSudanSwedenSwitzerlandSyriaTaiwanThailandTrinidad and TobagoTurkeyUgandaUkraineUruguayUzbekistanVenezuelaVietnamWest IndiesWestern AfricaWestern AsiaWestern EuropeYemenZaireZimbabweAzores
Currently Married
Income
Poverty
Unemployment
Labor Participation
Family Structure
Vehicle Availability
Education Level
Disability

Currently Married Comparison

Tsimshian

Immigrants from Ethiopia

Exceptional
Tragic
47.7%
CURRENTLY MARRIED
92.4/ 100
METRIC RATING
108th/ 347
METRIC RANK
44.5%
CURRENTLY MARRIED
0.7/ 100
METRIC RATING
243rd/ 347
METRIC RANK

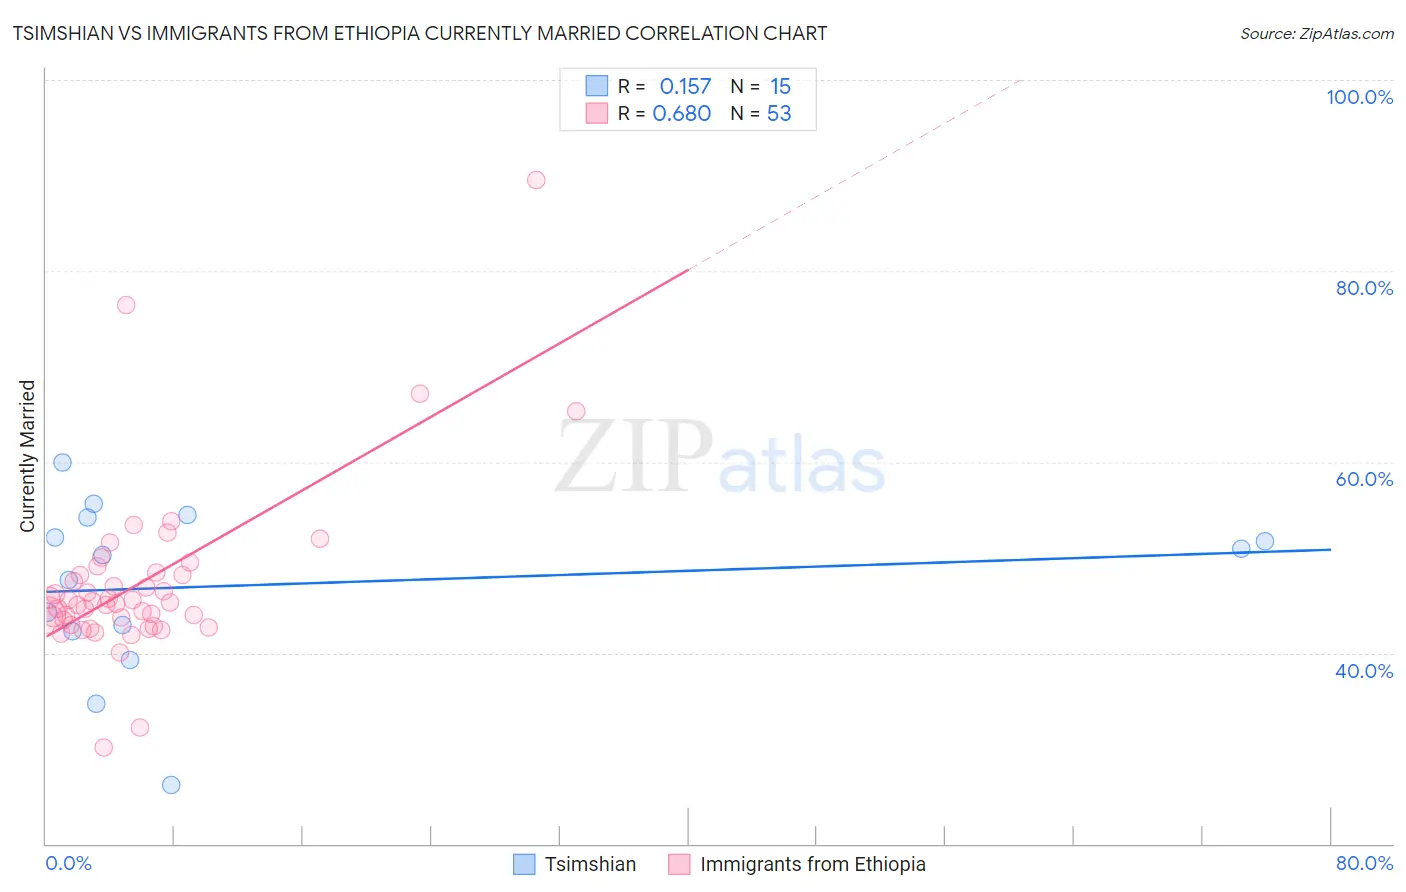
Tsimshian vs Immigrants from Ethiopia Currently Married Correlation Chart

The statistical analysis conducted on geographies consisting of 15,626,544 people shows a poor positive correlation between the proportion of Tsimshian and percentage of population currently married in the United States with a correlation coefficient (R) of 0.157 and weighted average of 47.7%. Similarly, the statistical analysis conducted on geographies consisting of 211,554,570 people shows a significant positive correlation between the proportion of Immigrants from Ethiopia and percentage of population currently married in the United States with a correlation coefficient (R) of 0.680 and weighted average of 44.5%, a difference of 7.2%.
Tsimshian vs Immigrants from Ethiopia Currently Married

Currently Married Correlation Summary

MeasurementTsimshianImmigrants from Ethiopia
Minimum26.2%30.1%
Maximum60.0%89.5%
Range33.8%59.4%
Mean47.1%47.4%
Median50.2%45.3%
Interquartile 25% (IQ1)42.2%43.2%
Interquartile 75% (IQ3)54.2%48.3%
Interquartile Range (IQR)12.0%5.0%
Standard Deviation (Sample)8.9%9.3%
Standard Deviation (Population)8.6%9.2%

Similar Demographics by Currently Married

Demographics Similar to Tsimshian by Currently Married

In terms of currently married, the demographic groups most similar to Tsimshian are Immigrants from Egypt (47.7%, a difference of 0.010%), Immigrants from Russia (47.7%, a difference of 0.050%), Immigrants from Italy (47.7%, a difference of 0.060%), Immigrants from Greece (47.7%, a difference of 0.090%), and Immigrants from Singapore (47.8%, a difference of 0.12%).
DemographicsRating | RankCurrently Married
Immigrants | Germany
94.1
/100
|
#101
Exceptional
47.8%
Turks
93.9
/100
|
#102
Exceptional
47.8%
Cypriots
93.7
/100
|
#103
Exceptional
47.8%
Serbians
93.6
/100
|
#104
Exceptional
47.8%
Immigrants | Singapore
93.3
/100
|
#105
Exceptional
47.8%
Immigrants | Greece
93.1
/100
|
#106
Exceptional
47.7%
Immigrants | Italy
92.9
/100
|
#107
Exceptional
47.7%
Tsimshian
92.4
/100
|
#108
Exceptional
47.7%
Immigrants | Egypt
92.3
/100
|
#109
Exceptional
47.7%
Immigrants | Russia
92.0
/100
|
#110
Exceptional
47.7%
Immigrants | Hungary
91.2
/100
|
#111
Exceptional
47.6%
Immigrants | Western Europe
91.1
/100
|
#112
Exceptional
47.6%
Immigrants | Denmark
90.9
/100
|
#113
Exceptional
47.6%
South Africans
90.5
/100
|
#114
Exceptional
47.6%
Immigrants | Indonesia
90.5
/100
|
#115
Exceptional
47.6%

Demographics Similar to Immigrants from Ethiopia by Currently Married

In terms of currently married, the demographic groups most similar to Immigrants from Ethiopia are Immigrants from Cambodia (44.5%, a difference of 0.010%), Ethiopian (44.5%, a difference of 0.040%), Japanese (44.5%, a difference of 0.070%), Immigrants from Mexico (44.5%, a difference of 0.10%), and Mexican American Indian (44.5%, a difference of 0.10%).
DemographicsRating | RankCurrently Married
Cubans
0.9
/100
|
#236
Tragic
44.6%
Seminole
0.9
/100
|
#237
Tragic
44.6%
Moroccans
0.9
/100
|
#238
Tragic
44.6%
Immigrants | Mexico
0.7
/100
|
#239
Tragic
44.5%
Mexican American Indians
0.7
/100
|
#240
Tragic
44.5%
Ethiopians
0.7
/100
|
#241
Tragic
44.5%
Immigrants | Cambodia
0.7
/100
|
#242
Tragic
44.5%
Immigrants | Ethiopia
0.7
/100
|
#243
Tragic
44.5%
Japanese
0.6
/100
|
#244
Tragic
44.5%
Immigrants | Armenia
0.4
/100
|
#245
Tragic
44.3%
Immigrants | Burma/Myanmar
0.4
/100
|
#246
Tragic
44.3%
Ugandans
0.4
/100
|
#247
Tragic
44.2%
Nicaraguans
0.3
/100
|
#248
Tragic
44.2%
Immigrants | Cameroon
0.3
/100
|
#249
Tragic
44.2%
Immigrants | Eastern Africa
0.3
/100
|
#250
Tragic
44.2%