Bahamian vs Iranian Family Households
COMPARE
Bahamian
Iranian
Family Households
Family Households Comparison
Bahamians
Iranians
63.3%
FAMILY HOUSEHOLDS
1.1/ 100
METRIC RATING
252nd/ 347
METRIC RANK
63.9%
FAMILY HOUSEHOLDS
13.5/ 100
METRIC RATING
202nd/ 347
METRIC RANK
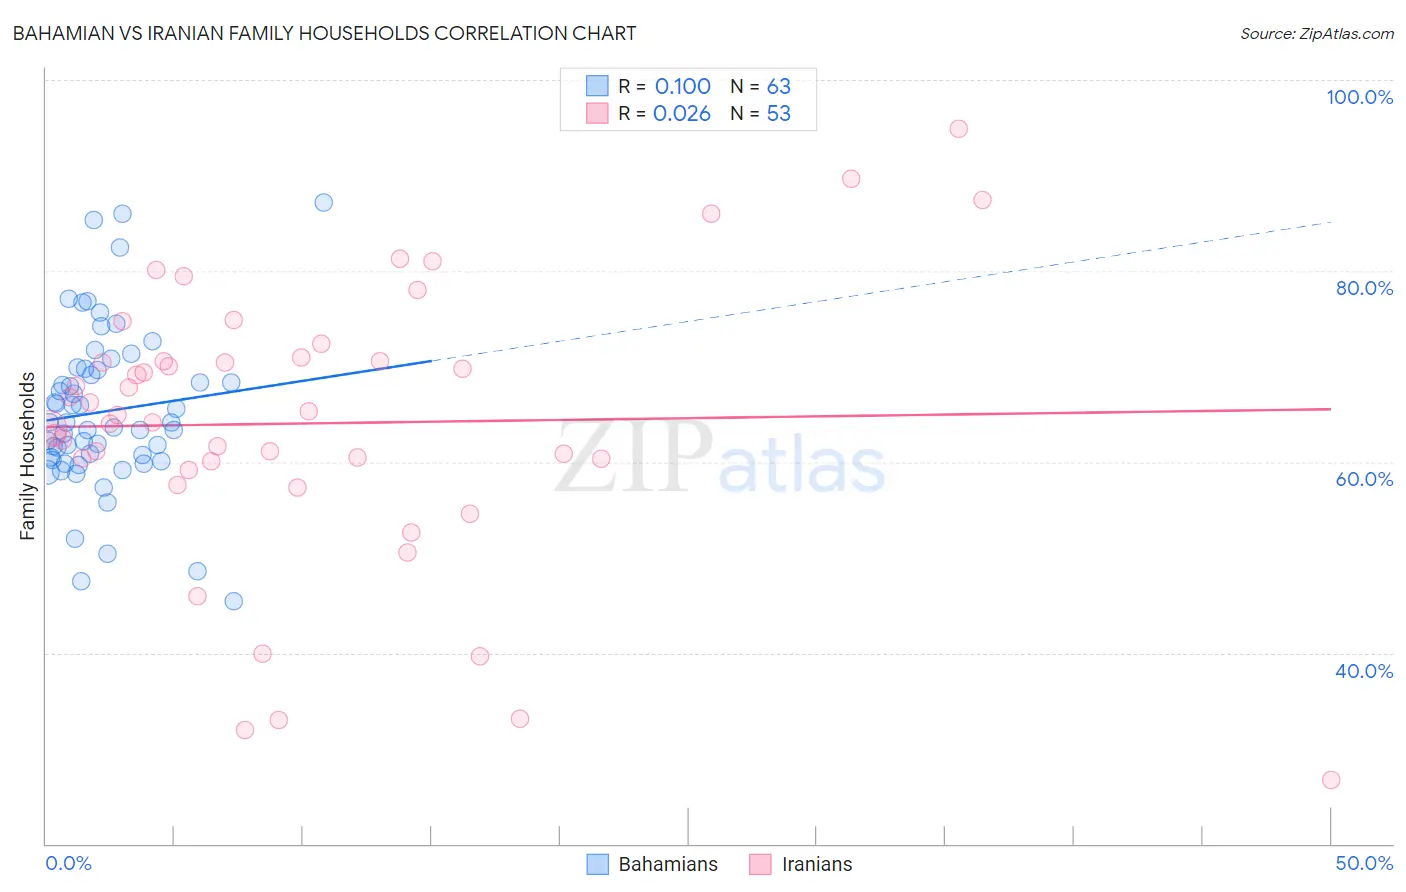
Bahamian vs Iranian Family Households Correlation Chart
The statistical analysis conducted on geographies consisting of 112,635,727 people shows a slight positive correlation between the proportion of Bahamians and percentage of family households in the United States with a correlation coefficient (R) of 0.100 and weighted average of 63.3%. Similarly, the statistical analysis conducted on geographies consisting of 316,654,989 people shows no correlation between the proportion of Iranians and percentage of family households in the United States with a correlation coefficient (R) of 0.026 and weighted average of 63.9%, a difference of 0.89%.
Family Households Correlation Summary
| Measurement | Bahamian | Iranian |
| Minimum | 45.4% | 26.7% |
| Maximum | 87.2% | 94.9% |
| Range | 41.8% | 68.2% |
| Mean | 65.3% | 64.0% |
| Median | 64.1% | 64.9% |
| Interquartile 25% (IQ1) | 60.1% | 59.6% |
| Interquartile 75% (IQ3) | 69.7% | 70.7% |
| Interquartile Range (IQR) | 9.6% | 11.2% |
| Standard Deviation (Sample) | 8.6% | 14.6% |
| Standard Deviation (Population) | 8.5% | 14.4% |
Similar Demographics by Family Households
Demographics Similar to Bahamians by Family Households
In terms of family households, the demographic groups most similar to Bahamians are Taiwanese (63.3%, a difference of 0.010%), Immigrants from Dominican Republic (63.3%, a difference of 0.020%), Slovak (63.3%, a difference of 0.030%), Potawatomi (63.3%, a difference of 0.050%), and Immigrants from Japan (63.4%, a difference of 0.070%).
| Demographics | Rating | Rank | Family Households |
| Immigrants | Dominica | 1.6 /100 | #245 | Tragic 63.4% |
| Immigrants | Ghana | 1.6 /100 | #246 | Tragic 63.4% |
| Immigrants | Uzbekistan | 1.5 /100 | #247 | Tragic 63.4% |
| Dominicans | 1.5 /100 | #248 | Tragic 63.4% |
| Russians | 1.4 /100 | #249 | Tragic 63.4% |
| Immigrants | Japan | 1.4 /100 | #250 | Tragic 63.4% |
| Taiwanese | 1.2 /100 | #251 | Tragic 63.3% |
| Bahamians | 1.1 /100 | #252 | Tragic 63.3% |
| Immigrants | Dominican Republic | 1.0 /100 | #253 | Tragic 63.3% |
| Slovaks | 1.0 /100 | #254 | Tragic 63.3% |
| Potawatomi | 1.0 /100 | #255 | Tragic 63.3% |
| Luxembourgers | 0.9 /100 | #256 | Tragic 63.3% |
| Icelanders | 0.8 /100 | #257 | Tragic 63.3% |
| Immigrants | Barbados | 0.7 /100 | #258 | Tragic 63.2% |
| Immigrants | Western Europe | 0.6 /100 | #259 | Tragic 63.2% |
Demographics Similar to Iranians by Family Households
In terms of family households, the demographic groups most similar to Iranians are Norwegian (63.9%, a difference of 0.010%), Immigrants from Uruguay (63.9%, a difference of 0.020%), Brazilian (63.9%, a difference of 0.030%), Immigrants from Lithuania (63.9%, a difference of 0.040%), and Nigerian (63.9%, a difference of 0.060%).
| Demographics | Rating | Rank | Family Households |
| Immigrants | North America | 20.0 /100 | #195 | Poor 64.0% |
| Immigrants | Canada | 19.2 /100 | #196 | Poor 64.0% |
| Seminole | 18.9 /100 | #197 | Poor 64.0% |
| Poles | 18.9 /100 | #198 | Poor 64.0% |
| Slavs | 18.6 /100 | #199 | Poor 64.0% |
| Immigrants | Malaysia | 17.9 /100 | #200 | Poor 64.0% |
| Immigrants | Eastern Europe | 17.2 /100 | #201 | Poor 64.0% |
| Iranians | 13.5 /100 | #202 | Poor 63.9% |
| Norwegians | 13.2 /100 | #203 | Poor 63.9% |
| Immigrants | Uruguay | 12.8 /100 | #204 | Poor 63.9% |
| Brazilians | 12.4 /100 | #205 | Poor 63.9% |
| Immigrants | Lithuania | 12.1 /100 | #206 | Poor 63.9% |
| Nigerians | 11.5 /100 | #207 | Poor 63.9% |
| Immigrants | Bangladesh | 11.4 /100 | #208 | Poor 63.9% |
| Sierra Leoneans | 11.2 /100 | #209 | Poor 63.9% |