Tohono O'odham vs Immigrants from Hong Kong Family Households with Children
COMPARE
Tohono O'odham
Immigrants from Hong Kong
Family Households with Children
Family Households with Children Comparison
Tohono O'odham
Immigrants from Hong Kong
28.0%
FAMILY HOUSEHOLDS WITH CHILDREN
97.6/ 100
METRIC RATING
109th/ 347
METRIC RANK
27.5%
FAMILY HOUSEHOLDS WITH CHILDREN
64.9/ 100
METRIC RATING
164th/ 347
METRIC RANK
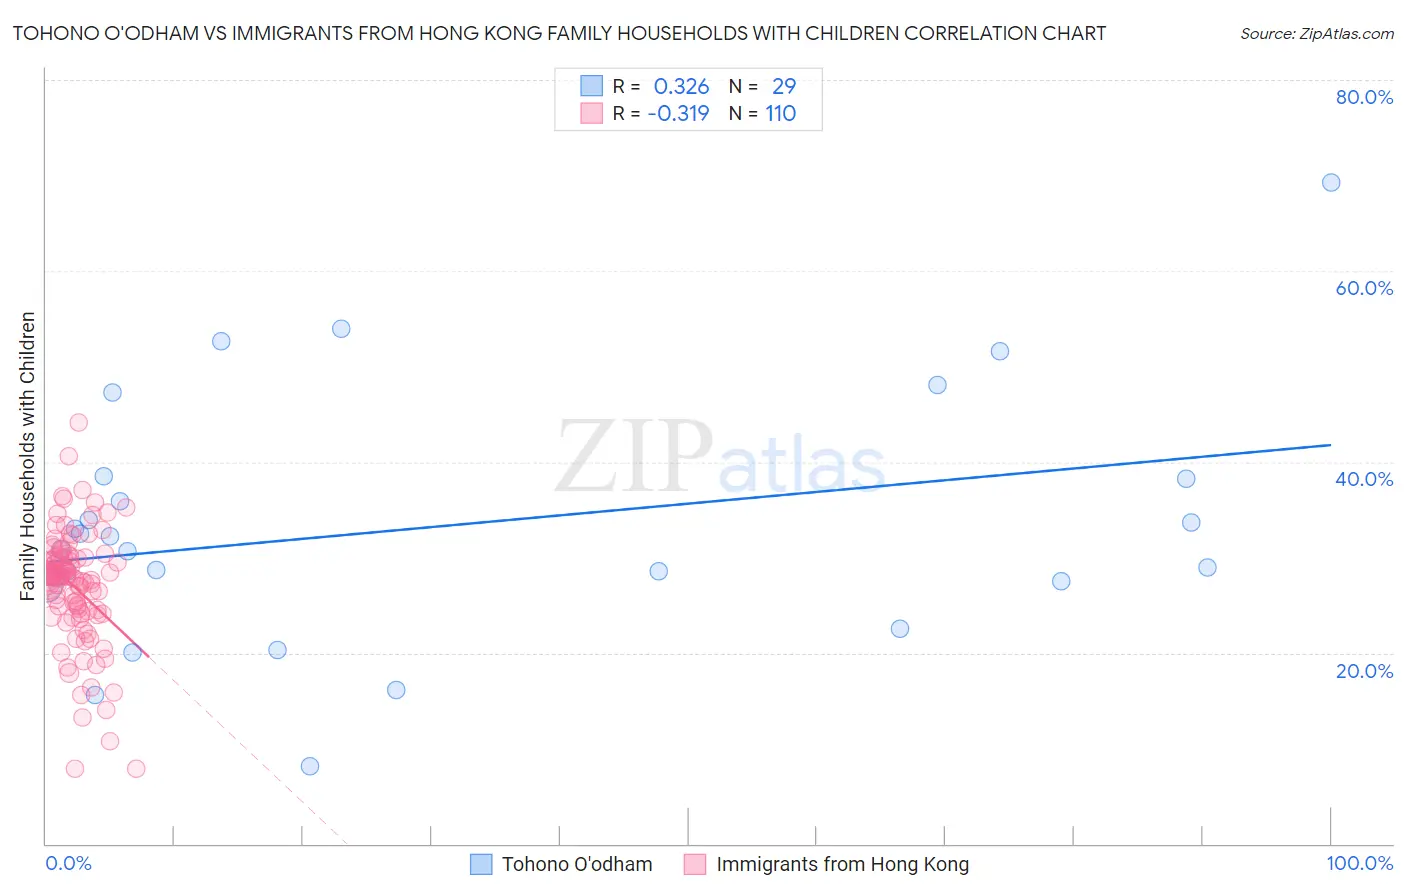
Tohono O'odham vs Immigrants from Hong Kong Family Households with Children Correlation Chart
The statistical analysis conducted on geographies consisting of 58,703,775 people shows a mild positive correlation between the proportion of Tohono O'odham and percentage of family households with children in the United States with a correlation coefficient (R) of 0.326 and weighted average of 28.0%. Similarly, the statistical analysis conducted on geographies consisting of 253,815,844 people shows a mild negative correlation between the proportion of Immigrants from Hong Kong and percentage of family households with children in the United States with a correlation coefficient (R) of -0.319 and weighted average of 27.5%, a difference of 1.7%.
Family Households with Children Correlation Summary
| Measurement | Tohono O'odham | Immigrants from Hong Kong |
| Minimum | 8.1% | 7.8% |
| Maximum | 69.3% | 44.2% |
| Range | 61.2% | 36.3% |
| Mean | 33.2% | 26.9% |
| Median | 30.8% | 28.0% |
| Interquartile 25% (IQ1) | 27.2% | 24.3% |
| Interquartile 75% (IQ3) | 38.3% | 30.0% |
| Interquartile Range (IQR) | 11.1% | 5.6% |
| Standard Deviation (Sample) | 13.1% | 6.0% |
| Standard Deviation (Population) | 12.9% | 6.0% |
Similar Demographics by Family Households with Children
Demographics Similar to Tohono O'odham by Family Households with Children
In terms of family households with children, the demographic groups most similar to Tohono O'odham are Immigrants from Burma/Myanmar (28.0%, a difference of 0.010%), Immigrants from Uganda (28.0%, a difference of 0.020%), Spaniard (28.0%, a difference of 0.040%), Immigrants from South America (28.0%, a difference of 0.090%), and Scandinavian (28.0%, a difference of 0.10%).
| Demographics | Rating | Rank | Family Households with Children |
| Assyrians/Chaldeans/Syriacs | 98.7 /100 | #102 | Exceptional 28.1% |
| Palestinians | 98.5 /100 | #103 | Exceptional 28.1% |
| Sioux | 98.3 /100 | #104 | Exceptional 28.1% |
| Choctaw | 98.3 /100 | #105 | Exceptional 28.1% |
| Immigrants | South America | 98.0 /100 | #106 | Exceptional 28.0% |
| Immigrants | Uganda | 97.7 /100 | #107 | Exceptional 28.0% |
| Immigrants | Burma/Myanmar | 97.7 /100 | #108 | Exceptional 28.0% |
| Tohono O'odham | 97.6 /100 | #109 | Exceptional 28.0% |
| Spaniards | 97.4 /100 | #110 | Exceptional 28.0% |
| Scandinavians | 97.1 /100 | #111 | Exceptional 28.0% |
| Immigrants | Middle Africa | 97.0 /100 | #112 | Exceptional 28.0% |
| Arabs | 97.0 /100 | #113 | Exceptional 28.0% |
| South American Indians | 96.9 /100 | #114 | Exceptional 28.0% |
| Immigrants | Africa | 96.8 /100 | #115 | Exceptional 28.0% |
| Pakistanis | 96.0 /100 | #116 | Exceptional 27.9% |
Demographics Similar to Immigrants from Hong Kong by Family Households with Children
In terms of family households with children, the demographic groups most similar to Immigrants from Hong Kong are Czech (27.5%, a difference of 0.010%), Alaskan Athabascan (27.6%, a difference of 0.050%), Immigrants from Bangladesh (27.6%, a difference of 0.050%), Subsaharan African (27.6%, a difference of 0.060%), and Immigrants from South Africa (27.5%, a difference of 0.080%).
| Demographics | Rating | Rank | Family Households with Children |
| Indians (Asian) | 71.6 /100 | #157 | Good 27.6% |
| Romanians | 70.8 /100 | #158 | Good 27.6% |
| Mongolians | 70.7 /100 | #159 | Good 27.6% |
| Sub-Saharan Africans | 67.5 /100 | #160 | Good 27.6% |
| Alaskan Athabascans | 67.1 /100 | #161 | Good 27.6% |
| Immigrants | Bangladesh | 67.0 /100 | #162 | Good 27.6% |
| Czechs | 65.3 /100 | #163 | Good 27.5% |
| Immigrants | Hong Kong | 64.9 /100 | #164 | Good 27.5% |
| Immigrants | South Africa | 61.3 /100 | #165 | Good 27.5% |
| Immigrants | Nonimmigrants | 61.2 /100 | #166 | Good 27.5% |
| Dominicans | 61.1 /100 | #167 | Good 27.5% |
| Immigrants | Kuwait | 60.9 /100 | #168 | Good 27.5% |
| Seminole | 56.9 /100 | #169 | Average 27.5% |
| Cherokee | 56.7 /100 | #170 | Average 27.5% |
| Blackfeet | 54.3 /100 | #171 | Average 27.5% |