Tlingit-Haida vs Yugoslavian Births to Unmarried Women
COMPARE
Tlingit-Haida
Yugoslavian
Births to Unmarried Women
Births to Unmarried Women Comparison
Tlingit-Haida
Yugoslavians
32.2%
BIRTHS TO UNMARRIED WOMEN
32.6/ 100
METRIC RATING
190th/ 347
METRIC RANK
30.8%
BIRTHS TO UNMARRIED WOMEN
75.1/ 100
METRIC RATING
154th/ 347
METRIC RANK
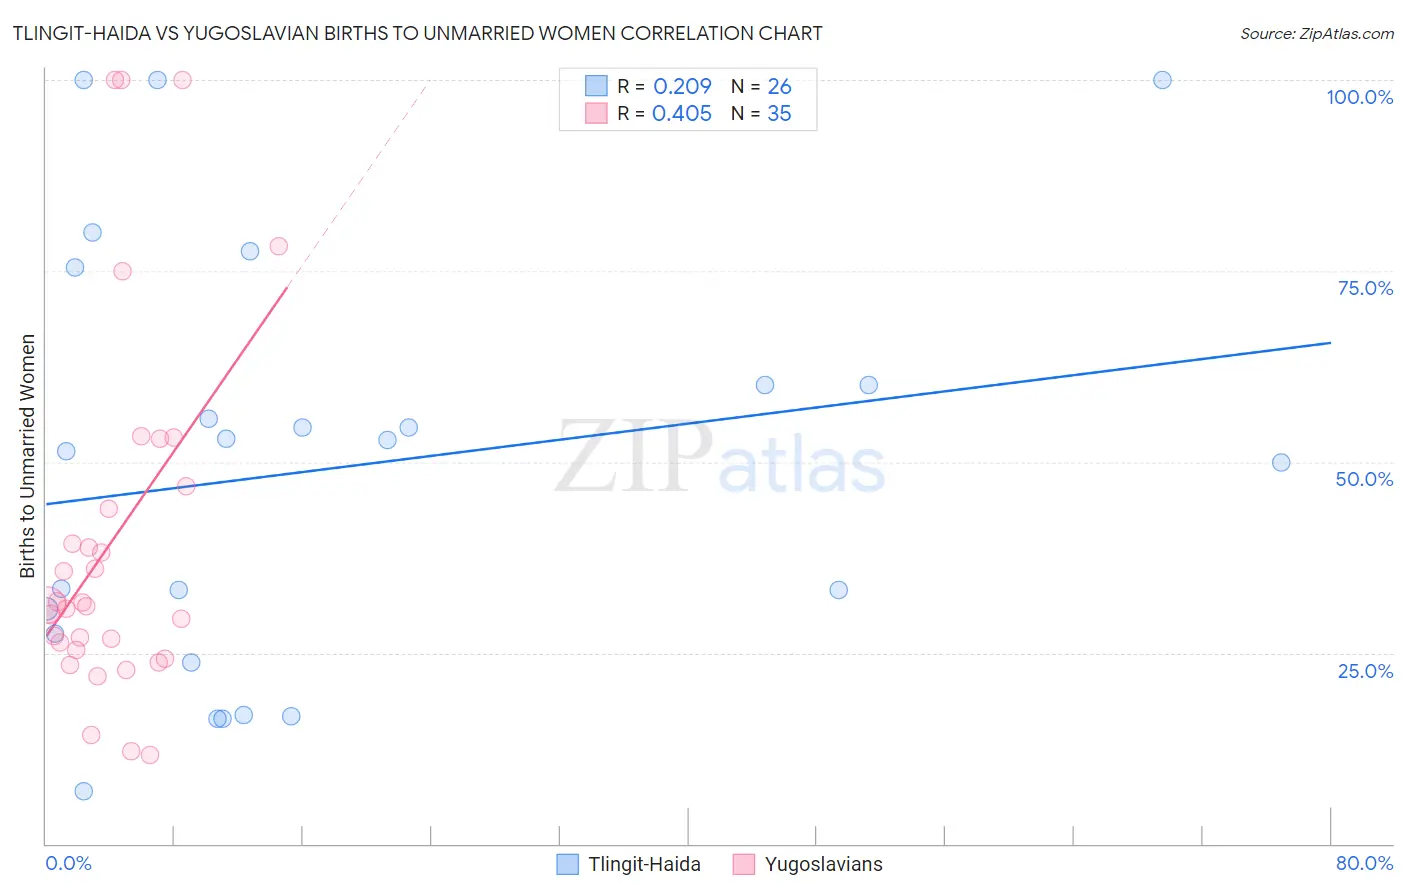
Tlingit-Haida vs Yugoslavian Births to Unmarried Women Correlation Chart
The statistical analysis conducted on geographies consisting of 59,376,059 people shows a weak positive correlation between the proportion of Tlingit-Haida and percentage of births to unmarried women in the United States with a correlation coefficient (R) of 0.209 and weighted average of 32.2%. Similarly, the statistical analysis conducted on geographies consisting of 270,567,772 people shows a moderate positive correlation between the proportion of Yugoslavians and percentage of births to unmarried women in the United States with a correlation coefficient (R) of 0.405 and weighted average of 30.8%, a difference of 4.4%.
Births to Unmarried Women Correlation Summary
| Measurement | Tlingit-Haida | Yugoslavian |
| Minimum | 6.9% | 11.7% |
| Maximum | 100.0% | 100.0% |
| Range | 93.1% | 88.3% |
| Mean | 49.2% | 39.8% |
| Median | 52.2% | 31.3% |
| Interquartile 25% (IQ1) | 27.6% | 25.4% |
| Interquartile 75% (IQ3) | 60.0% | 46.8% |
| Interquartile Range (IQR) | 32.4% | 21.4% |
| Standard Deviation (Sample) | 27.4% | 23.8% |
| Standard Deviation (Population) | 26.9% | 23.5% |
Similar Demographics by Births to Unmarried Women
Demographics Similar to Tlingit-Haida by Births to Unmarried Women
In terms of births to unmarried women, the demographic groups most similar to Tlingit-Haida are Irish (32.2%, a difference of 0.020%), Colombian (32.2%, a difference of 0.080%), Fijian (32.3%, a difference of 0.17%), Immigrants from Kenya (32.1%, a difference of 0.44%), and Osage (32.1%, a difference of 0.47%).
| Demographics | Rating | Rank | Births to Unmarried Women |
| Canadians | 41.4 /100 | #183 | Average 31.9% |
| Immigrants | South America | 40.7 /100 | #184 | Average 32.0% |
| Germans | 39.5 /100 | #185 | Fair 32.0% |
| Welsh | 38.2 /100 | #186 | Fair 32.0% |
| Czechoslovakians | 38.0 /100 | #187 | Fair 32.0% |
| Osage | 37.1 /100 | #188 | Fair 32.1% |
| Immigrants | Kenya | 36.9 /100 | #189 | Fair 32.1% |
| Tlingit-Haida | 32.6 /100 | #190 | Fair 32.2% |
| Irish | 32.4 /100 | #191 | Fair 32.2% |
| Colombians | 31.9 /100 | #192 | Fair 32.2% |
| Fijians | 31.1 /100 | #193 | Fair 32.3% |
| Sudanese | 27.3 /100 | #194 | Fair 32.4% |
| Samoans | 21.9 /100 | #195 | Fair 32.6% |
| Immigrants | Colombia | 21.7 /100 | #196 | Fair 32.6% |
| Immigrants | Immigrants | 20.6 /100 | #197 | Fair 32.7% |
Demographics Similar to Yugoslavians by Births to Unmarried Women
In terms of births to unmarried women, the demographic groups most similar to Yugoslavians are British (30.8%, a difference of 0.12%), Polish (30.8%, a difference of 0.14%), Immigrants from Bangladesh (30.9%, a difference of 0.15%), Carpatho Rusyn (30.9%, a difference of 0.20%), and Italian (30.8%, a difference of 0.25%).
| Demographics | Rating | Rank | Births to Unmarried Women |
| Immigrants | Oceania | 81.2 /100 | #147 | Excellent 30.6% |
| Chileans | 79.1 /100 | #148 | Good 30.7% |
| Serbians | 78.8 /100 | #149 | Good 30.7% |
| Somalis | 77.8 /100 | #150 | Good 30.7% |
| Italians | 77.0 /100 | #151 | Good 30.8% |
| Poles | 76.2 /100 | #152 | Good 30.8% |
| British | 76.0 /100 | #153 | Good 30.8% |
| Yugoslavians | 75.1 /100 | #154 | Good 30.8% |
| Immigrants | Bangladesh | 73.9 /100 | #155 | Good 30.9% |
| Carpatho Rusyns | 73.5 /100 | #156 | Good 30.9% |
| Immigrants | Eastern Africa | 72.1 /100 | #157 | Good 31.0% |
| Austrians | 69.9 /100 | #158 | Good 31.0% |
| Immigrants | England | 69.4 /100 | #159 | Good 31.1% |
| Immigrants | Western Europe | 69.3 /100 | #160 | Good 31.1% |
| Immigrants | Southern Europe | 68.7 /100 | #161 | Good 31.1% |