Tlingit-Haida vs Icelander Births to Unmarried Women
COMPARE
Tlingit-Haida
Icelander
Births to Unmarried Women
Births to Unmarried Women Comparison
Tlingit-Haida
Icelanders
32.2%
BIRTHS TO UNMARRIED WOMEN
32.6/ 100
METRIC RATING
190th/ 347
METRIC RANK
30.3%
BIRTHS TO UNMARRIED WOMEN
86.0/ 100
METRIC RATING
128th/ 347
METRIC RANK
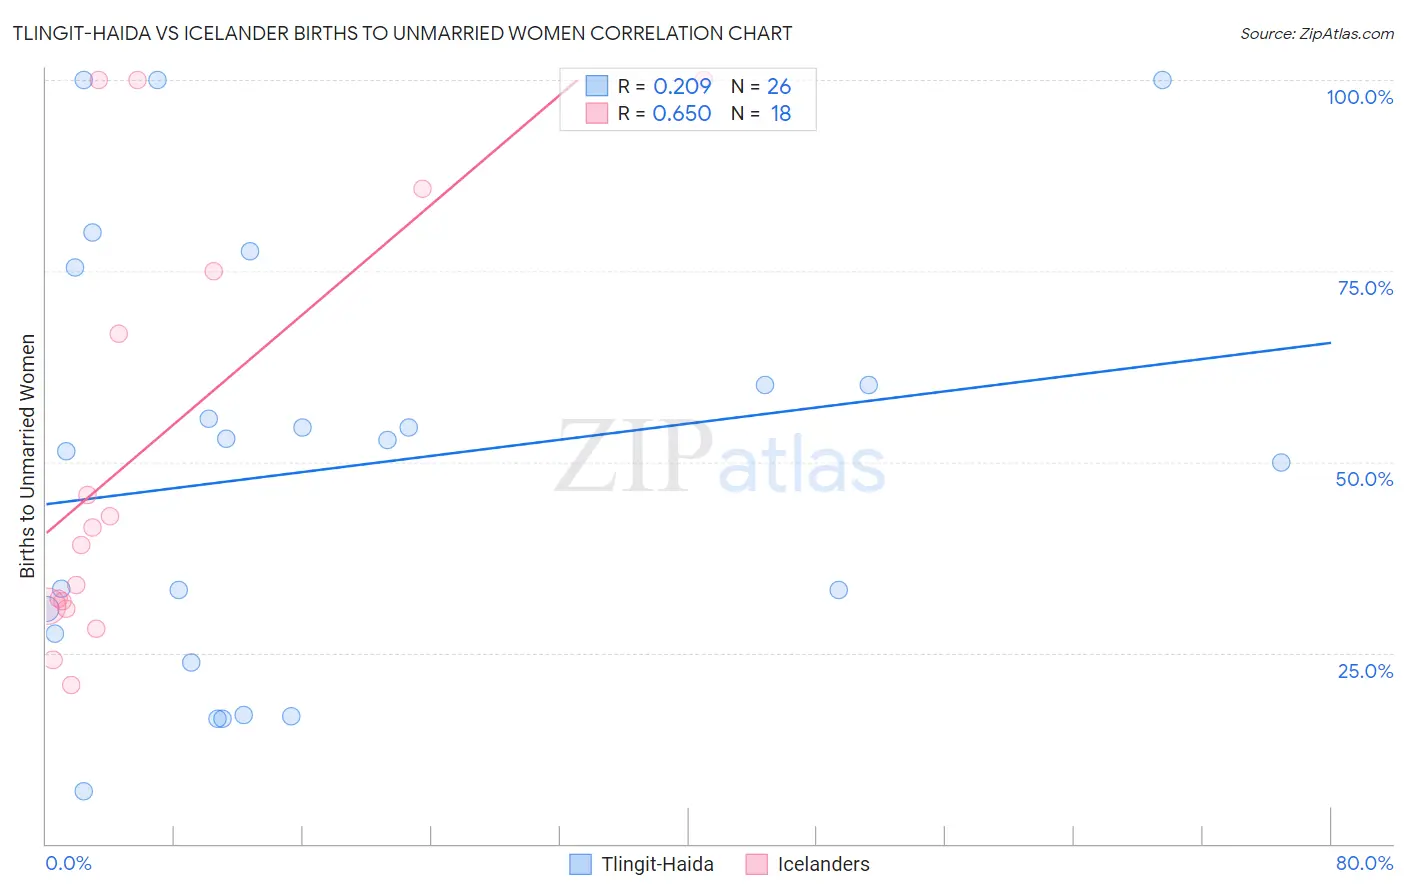
Tlingit-Haida vs Icelander Births to Unmarried Women Correlation Chart
The statistical analysis conducted on geographies consisting of 59,376,059 people shows a weak positive correlation between the proportion of Tlingit-Haida and percentage of births to unmarried women in the United States with a correlation coefficient (R) of 0.209 and weighted average of 32.2%. Similarly, the statistical analysis conducted on geographies consisting of 153,143,056 people shows a significant positive correlation between the proportion of Icelanders and percentage of births to unmarried women in the United States with a correlation coefficient (R) of 0.650 and weighted average of 30.3%, a difference of 6.3%.
Births to Unmarried Women Correlation Summary
| Measurement | Tlingit-Haida | Icelander |
| Minimum | 6.9% | 20.8% |
| Maximum | 100.0% | 100.0% |
| Range | 93.1% | 79.2% |
| Mean | 49.2% | 51.6% |
| Median | 52.2% | 40.2% |
| Interquartile 25% (IQ1) | 27.6% | 31.0% |
| Interquartile 75% (IQ3) | 60.0% | 75.0% |
| Interquartile Range (IQR) | 32.4% | 44.0% |
| Standard Deviation (Sample) | 27.4% | 28.2% |
| Standard Deviation (Population) | 26.9% | 27.4% |
Similar Demographics by Births to Unmarried Women
Demographics Similar to Tlingit-Haida by Births to Unmarried Women
In terms of births to unmarried women, the demographic groups most similar to Tlingit-Haida are Irish (32.2%, a difference of 0.020%), Colombian (32.2%, a difference of 0.080%), Fijian (32.3%, a difference of 0.17%), Immigrants from Kenya (32.1%, a difference of 0.44%), and Osage (32.1%, a difference of 0.47%).
| Demographics | Rating | Rank | Births to Unmarried Women |
| Canadians | 41.4 /100 | #183 | Average 31.9% |
| Immigrants | South America | 40.7 /100 | #184 | Average 32.0% |
| Germans | 39.5 /100 | #185 | Fair 32.0% |
| Welsh | 38.2 /100 | #186 | Fair 32.0% |
| Czechoslovakians | 38.0 /100 | #187 | Fair 32.0% |
| Osage | 37.1 /100 | #188 | Fair 32.1% |
| Immigrants | Kenya | 36.9 /100 | #189 | Fair 32.1% |
| Tlingit-Haida | 32.6 /100 | #190 | Fair 32.2% |
| Irish | 32.4 /100 | #191 | Fair 32.2% |
| Colombians | 31.9 /100 | #192 | Fair 32.2% |
| Fijians | 31.1 /100 | #193 | Fair 32.3% |
| Sudanese | 27.3 /100 | #194 | Fair 32.4% |
| Samoans | 21.9 /100 | #195 | Fair 32.6% |
| Immigrants | Colombia | 21.7 /100 | #196 | Fair 32.6% |
| Immigrants | Immigrants | 20.6 /100 | #197 | Fair 32.7% |
Demographics Similar to Icelanders by Births to Unmarried Women
In terms of births to unmarried women, the demographic groups most similar to Icelanders are Immigrants from Spain (30.3%, a difference of 0.040%), Immigrants from Bosnia and Herzegovina (30.3%, a difference of 0.050%), Immigrants from Zimbabwe (30.3%, a difference of 0.060%), New Zealander (30.3%, a difference of 0.10%), and Immigrants from Morocco (30.4%, a difference of 0.15%).
| Demographics | Rating | Rank | Births to Unmarried Women |
| Koreans | 88.9 /100 | #121 | Excellent 30.1% |
| Immigrants | Argentina | 88.7 /100 | #122 | Excellent 30.1% |
| Syrians | 88.2 /100 | #123 | Excellent 30.2% |
| Croatians | 88.0 /100 | #124 | Excellent 30.2% |
| Vietnamese | 87.7 /100 | #125 | Excellent 30.2% |
| Europeans | 87.2 /100 | #126 | Excellent 30.2% |
| Chinese | 87.1 /100 | #127 | Excellent 30.2% |
| Icelanders | 86.0 /100 | #128 | Excellent 30.3% |
| Immigrants | Spain | 85.8 /100 | #129 | Excellent 30.3% |
| Immigrants | Bosnia and Herzegovina | 85.7 /100 | #130 | Excellent 30.3% |
| Immigrants | Zimbabwe | 85.7 /100 | #131 | Excellent 30.3% |
| New Zealanders | 85.5 /100 | #132 | Excellent 30.3% |
| Immigrants | Morocco | 85.2 /100 | #133 | Excellent 30.4% |
| Immigrants | South Eastern Asia | 85.2 /100 | #134 | Excellent 30.4% |
| Brazilians | 84.8 /100 | #135 | Excellent 30.4% |