Immigrants from Philippines vs Yugoslavian Births to Unmarried Women
COMPARE
Immigrants from Philippines
Yugoslavian
Births to Unmarried Women
Births to Unmarried Women Comparison
Immigrants from Philippines
Yugoslavians
30.4%
BIRTHS TO UNMARRIED WOMEN
83.9/ 100
METRIC RATING
137th/ 347
METRIC RANK
30.8%
BIRTHS TO UNMARRIED WOMEN
75.1/ 100
METRIC RATING
154th/ 347
METRIC RANK
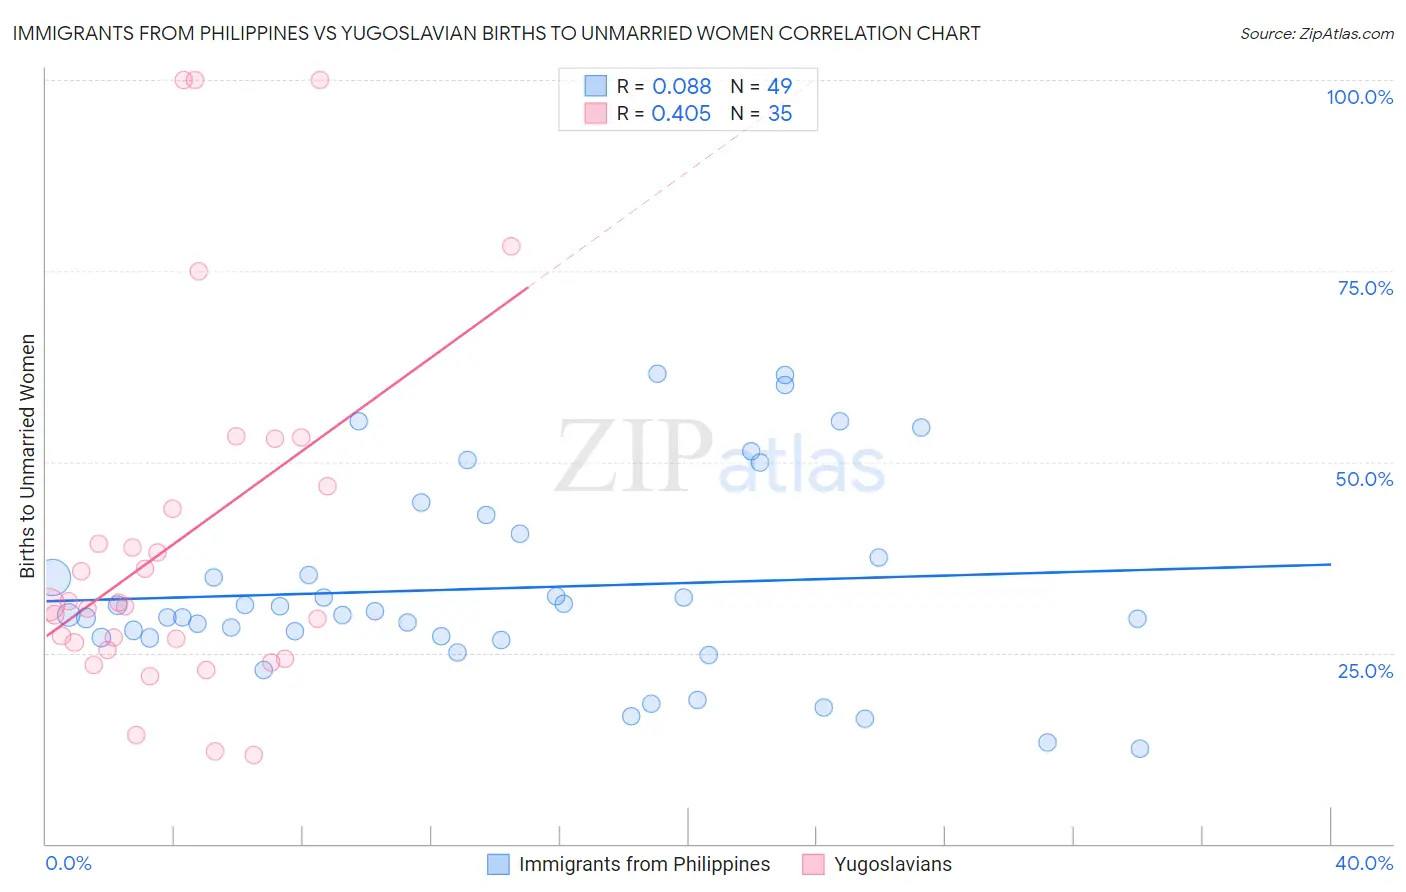
Immigrants from Philippines vs Yugoslavian Births to Unmarried Women Correlation Chart
The statistical analysis conducted on geographies consisting of 435,603,285 people shows a slight positive correlation between the proportion of Immigrants from Philippines and percentage of births to unmarried women in the United States with a correlation coefficient (R) of 0.088 and weighted average of 30.4%. Similarly, the statistical analysis conducted on geographies consisting of 270,567,772 people shows a moderate positive correlation between the proportion of Yugoslavians and percentage of births to unmarried women in the United States with a correlation coefficient (R) of 0.405 and weighted average of 30.8%, a difference of 1.3%.
Births to Unmarried Women Correlation Summary
| Measurement | Immigrants from Philippines | Yugoslavian |
| Minimum | 12.5% | 11.7% |
| Maximum | 61.5% | 100.0% |
| Range | 49.0% | 88.3% |
| Mean | 33.4% | 39.8% |
| Median | 30.0% | 31.3% |
| Interquartile 25% (IQ1) | 27.0% | 25.4% |
| Interquartile 75% (IQ3) | 39.0% | 46.8% |
| Interquartile Range (IQR) | 12.0% | 21.4% |
| Standard Deviation (Sample) | 12.6% | 23.8% |
| Standard Deviation (Population) | 12.5% | 23.5% |
Demographics Similar to Immigrants from Philippines and Yugoslavians by Births to Unmarried Women
In terms of births to unmarried women, the demographic groups most similar to Immigrants from Philippines are Puget Sound Salish (30.4%, a difference of 0.0%), Immigrants from Canada (30.4%, a difference of 0.040%), Immigrants from Scotland (30.4%, a difference of 0.13%), Swiss (30.5%, a difference of 0.14%), and Brazilian (30.4%, a difference of 0.16%). Similarly, the demographic groups most similar to Yugoslavians are British (30.8%, a difference of 0.12%), Polish (30.8%, a difference of 0.14%), Immigrants from Bangladesh (30.9%, a difference of 0.15%), Italian (30.8%, a difference of 0.25%), and Somali (30.7%, a difference of 0.36%).
| Demographics | Rating | Rank | Births to Unmarried Women |
| Brazilians | 84.8 /100 | #135 | Excellent 30.4% |
| Immigrants | Scotland | 84.6 /100 | #136 | Excellent 30.4% |
| Immigrants | Philippines | 83.9 /100 | #137 | Excellent 30.4% |
| Puget Sound Salish | 83.9 /100 | #138 | Excellent 30.4% |
| Immigrants | Canada | 83.7 /100 | #139 | Excellent 30.4% |
| Swiss | 83.1 /100 | #140 | Excellent 30.5% |
| Pakistanis | 83.0 /100 | #141 | Excellent 30.5% |
| South Africans | 82.7 /100 | #142 | Excellent 30.5% |
| Immigrants | Uganda | 82.6 /100 | #143 | Excellent 30.5% |
| Czechs | 82.1 /100 | #144 | Excellent 30.5% |
| Immigrants | North America | 81.5 /100 | #145 | Excellent 30.6% |
| Northern Europeans | 81.4 /100 | #146 | Excellent 30.6% |
| Immigrants | Oceania | 81.2 /100 | #147 | Excellent 30.6% |
| Chileans | 79.1 /100 | #148 | Good 30.7% |
| Serbians | 78.8 /100 | #149 | Good 30.7% |
| Somalis | 77.8 /100 | #150 | Good 30.7% |
| Italians | 77.0 /100 | #151 | Good 30.8% |
| Poles | 76.2 /100 | #152 | Good 30.8% |
| British | 76.0 /100 | #153 | Good 30.8% |
| Yugoslavians | 75.1 /100 | #154 | Good 30.8% |
| Immigrants | Bangladesh | 73.9 /100 | #155 | Good 30.9% |