Syrian vs U.S. Virgin Islander Currently Married
COMPARE
Syrian
U.S. Virgin Islander
Currently Married
Currently Married Comparison
Syrians
U.S. Virgin Islanders
47.5%
CURRENTLY MARRIED
88.9/ 100
METRIC RATING
120th/ 347
METRIC RANK
40.7%
CURRENTLY MARRIED
0.0/ 100
METRIC RATING
325th/ 347
METRIC RANK
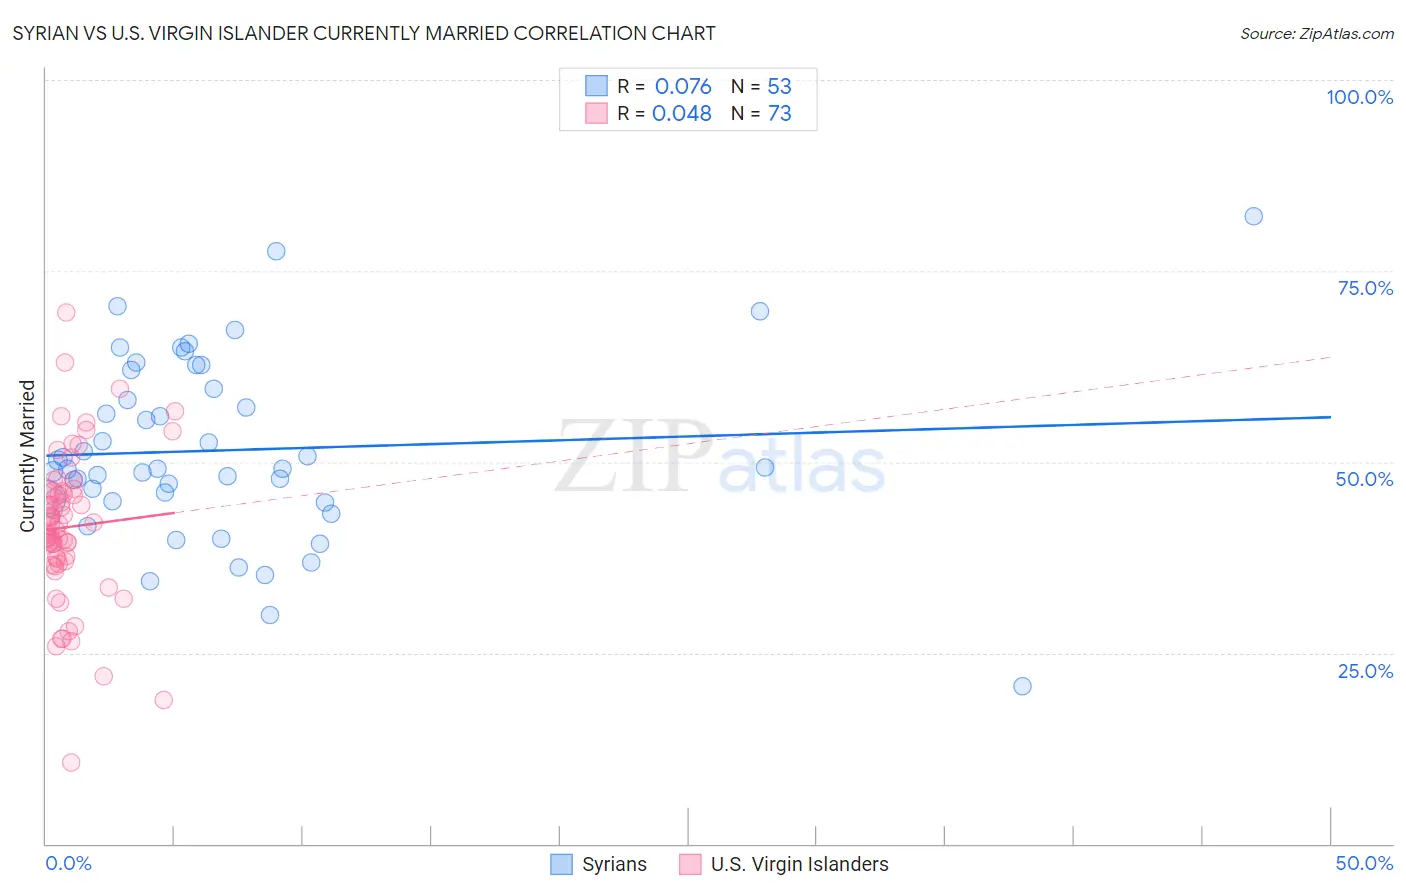
Syrian vs U.S. Virgin Islander Currently Married Correlation Chart
The statistical analysis conducted on geographies consisting of 266,298,061 people shows a slight positive correlation between the proportion of Syrians and percentage of population currently married in the United States with a correlation coefficient (R) of 0.076 and weighted average of 47.5%. Similarly, the statistical analysis conducted on geographies consisting of 87,525,763 people shows no correlation between the proportion of U.S. Virgin Islanders and percentage of population currently married in the United States with a correlation coefficient (R) of 0.048 and weighted average of 40.7%, a difference of 16.8%.
Currently Married Correlation Summary
| Measurement | Syrian | U.S. Virgin Islander |
| Minimum | 20.6% | 10.7% |
| Maximum | 82.1% | 69.6% |
| Range | 61.5% | 58.9% |
| Mean | 51.6% | 41.5% |
| Median | 49.1% | 41.7% |
| Interquartile 25% (IQ1) | 45.0% | 37.2% |
| Interquartile 75% (IQ3) | 60.8% | 46.2% |
| Interquartile Range (IQR) | 15.7% | 9.0% |
| Standard Deviation (Sample) | 11.8% | 9.8% |
| Standard Deviation (Population) | 11.7% | 9.7% |
Similar Demographics by Currently Married
Demographics Similar to Syrians by Currently Married
In terms of currently married, the demographic groups most similar to Syrians are Immigrants from Croatia (47.5%, a difference of 0.030%), Osage (47.5%, a difference of 0.090%), Immigrants from Philippines (47.6%, a difference of 0.12%), Australian (47.6%, a difference of 0.12%), and Puget Sound Salish (47.6%, a difference of 0.13%).
| Demographics | Rating | Rank | Currently Married |
| Immigrants | Denmark | 90.9 /100 | #113 | Exceptional 47.6% |
| South Africans | 90.5 /100 | #114 | Exceptional 47.6% |
| Immigrants | Indonesia | 90.5 /100 | #115 | Exceptional 47.6% |
| Palestinians | 90.4 /100 | #116 | Exceptional 47.6% |
| Puget Sound Salish | 90.3 /100 | #117 | Exceptional 47.6% |
| Immigrants | Philippines | 90.2 /100 | #118 | Exceptional 47.6% |
| Australians | 90.2 /100 | #119 | Exceptional 47.6% |
| Syrians | 88.9 /100 | #120 | Excellent 47.5% |
| Immigrants | Croatia | 88.6 /100 | #121 | Excellent 47.5% |
| Osage | 87.9 /100 | #122 | Excellent 47.5% |
| Immigrants | Kazakhstan | 87.2 /100 | #123 | Excellent 47.4% |
| Laotians | 86.6 /100 | #124 | Excellent 47.4% |
| Okinawans | 85.3 /100 | #125 | Excellent 47.4% |
| Immigrants | Jordan | 84.9 /100 | #126 | Excellent 47.4% |
| New Zealanders | 84.9 /100 | #127 | Excellent 47.4% |
Demographics Similar to U.S. Virgin Islanders by Currently Married
In terms of currently married, the demographic groups most similar to U.S. Virgin Islanders are Immigrants from Senegal (40.7%, a difference of 0.050%), Immigrants from West Indies (40.7%, a difference of 0.060%), Barbadian (40.6%, a difference of 0.14%), Senegalese (40.6%, a difference of 0.31%), and Arapaho (40.5%, a difference of 0.35%).
| Demographics | Rating | Rank | Currently Married |
| Bahamians | 0.0 /100 | #318 | Tragic 41.2% |
| Immigrants | Somalia | 0.0 /100 | #319 | Tragic 41.2% |
| Immigrants | Jamaica | 0.0 /100 | #320 | Tragic 41.1% |
| Immigrants | Congo | 0.0 /100 | #321 | Tragic 41.1% |
| Immigrants | Haiti | 0.0 /100 | #322 | Tragic 41.0% |
| Immigrants | West Indies | 0.0 /100 | #323 | Tragic 40.7% |
| Immigrants | Senegal | 0.0 /100 | #324 | Tragic 40.7% |
| U.S. Virgin Islanders | 0.0 /100 | #325 | Tragic 40.7% |
| Barbadians | 0.0 /100 | #326 | Tragic 40.6% |
| Senegalese | 0.0 /100 | #327 | Tragic 40.6% |
| Arapaho | 0.0 /100 | #328 | Tragic 40.5% |
| Crow | 0.0 /100 | #329 | Tragic 40.4% |
| Immigrants | Dominica | 0.0 /100 | #330 | Tragic 40.3% |
| Immigrants | Barbados | 0.0 /100 | #331 | Tragic 40.3% |
| Immigrants | St. Vincent and the Grenadines | 0.0 /100 | #332 | Tragic 40.1% |