Syrian vs Celtic Currently Married
COMPARE
Syrian
Celtic
Currently Married
Currently Married Comparison
Syrians
Celtics
47.5%
CURRENTLY MARRIED
88.9/ 100
METRIC RATING
120th/ 347
METRIC RANK
47.8%
CURRENTLY MARRIED
94.2/ 100
METRIC RATING
100th/ 347
METRIC RANK
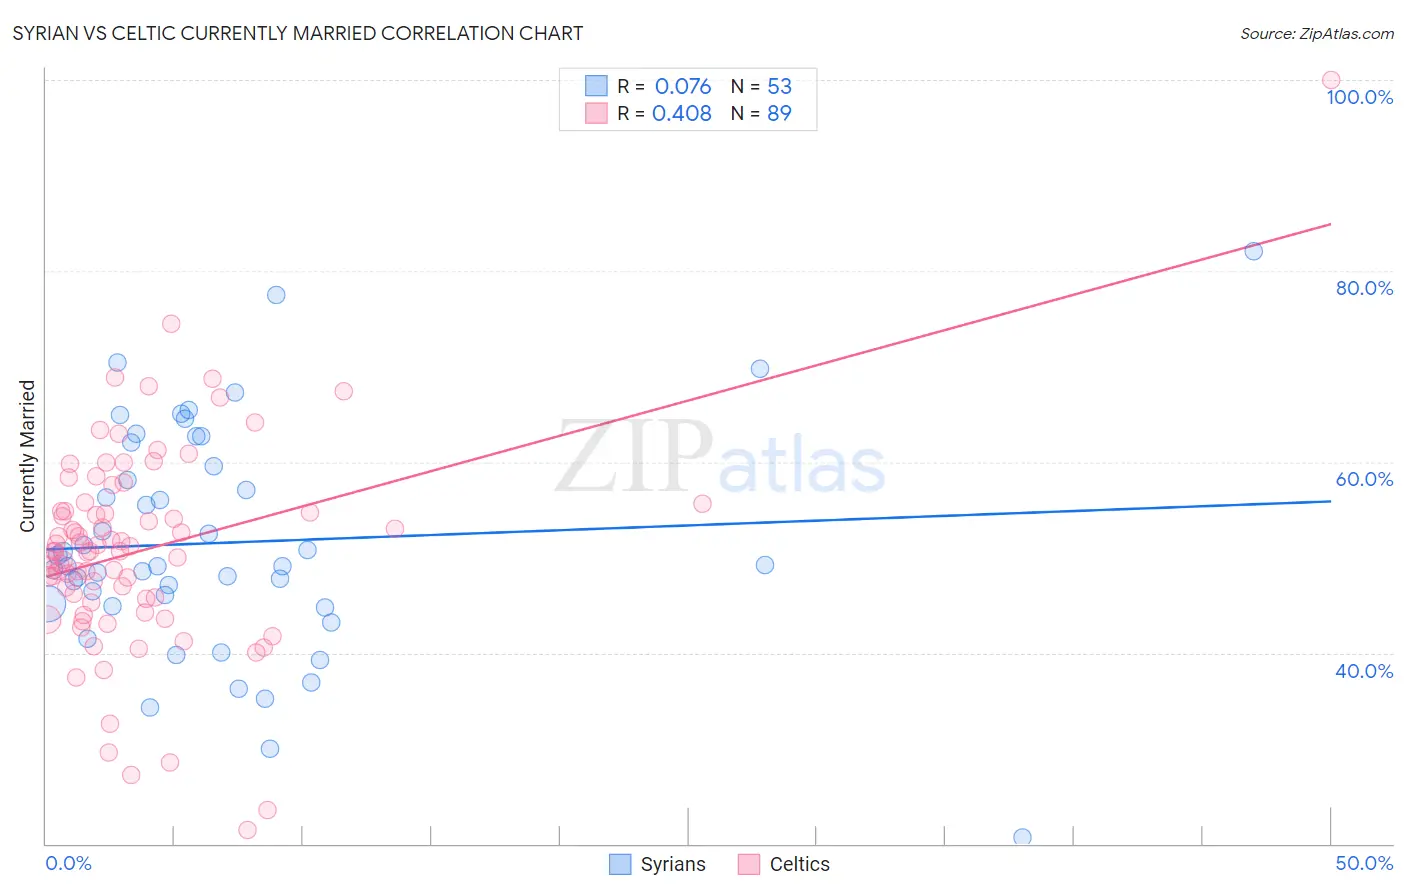
Syrian vs Celtic Currently Married Correlation Chart
The statistical analysis conducted on geographies consisting of 266,298,061 people shows a slight positive correlation between the proportion of Syrians and percentage of population currently married in the United States with a correlation coefficient (R) of 0.076 and weighted average of 47.5%. Similarly, the statistical analysis conducted on geographies consisting of 168,877,326 people shows a moderate positive correlation between the proportion of Celtics and percentage of population currently married in the United States with a correlation coefficient (R) of 0.408 and weighted average of 47.8%, a difference of 0.62%.
Currently Married Correlation Summary
| Measurement | Syrian | Celtic |
| Minimum | 20.6% | 21.4% |
| Maximum | 82.1% | 100.0% |
| Range | 61.5% | 78.6% |
| Mean | 51.6% | 50.8% |
| Median | 49.1% | 50.7% |
| Interquartile 25% (IQ1) | 45.0% | 45.4% |
| Interquartile 75% (IQ3) | 60.8% | 55.2% |
| Interquartile Range (IQR) | 15.7% | 9.8% |
| Standard Deviation (Sample) | 11.8% | 11.1% |
| Standard Deviation (Population) | 11.7% | 11.0% |
Demographics Similar to Syrians and Celtics by Currently Married
In terms of currently married, the demographic groups most similar to Syrians are Immigrants from Philippines (47.6%, a difference of 0.12%), Australian (47.6%, a difference of 0.12%), Puget Sound Salish (47.6%, a difference of 0.13%), Palestinian (47.6%, a difference of 0.14%), and Immigrants from Indonesia (47.6%, a difference of 0.15%). Similarly, the demographic groups most similar to Celtics are Immigrants from Germany (47.8%, a difference of 0.020%), Turkish (47.8%, a difference of 0.040%), Cypriot (47.8%, a difference of 0.070%), Serbian (47.8%, a difference of 0.080%), and Immigrants from Singapore (47.8%, a difference of 0.13%).
| Demographics | Rating | Rank | Currently Married |
| Celtics | 94.2 /100 | #100 | Exceptional 47.8% |
| Immigrants | Germany | 94.1 /100 | #101 | Exceptional 47.8% |
| Turks | 93.9 /100 | #102 | Exceptional 47.8% |
| Cypriots | 93.7 /100 | #103 | Exceptional 47.8% |
| Serbians | 93.6 /100 | #104 | Exceptional 47.8% |
| Immigrants | Singapore | 93.3 /100 | #105 | Exceptional 47.8% |
| Immigrants | Greece | 93.1 /100 | #106 | Exceptional 47.7% |
| Immigrants | Italy | 92.9 /100 | #107 | Exceptional 47.7% |
| Tsimshian | 92.4 /100 | #108 | Exceptional 47.7% |
| Immigrants | Egypt | 92.3 /100 | #109 | Exceptional 47.7% |
| Immigrants | Russia | 92.0 /100 | #110 | Exceptional 47.7% |
| Immigrants | Hungary | 91.2 /100 | #111 | Exceptional 47.6% |
| Immigrants | Western Europe | 91.1 /100 | #112 | Exceptional 47.6% |
| Immigrants | Denmark | 90.9 /100 | #113 | Exceptional 47.6% |
| South Africans | 90.5 /100 | #114 | Exceptional 47.6% |
| Immigrants | Indonesia | 90.5 /100 | #115 | Exceptional 47.6% |
| Palestinians | 90.4 /100 | #116 | Exceptional 47.6% |
| Puget Sound Salish | 90.3 /100 | #117 | Exceptional 47.6% |
| Immigrants | Philippines | 90.2 /100 | #118 | Exceptional 47.6% |
| Australians | 90.2 /100 | #119 | Exceptional 47.6% |
| Syrians | 88.9 /100 | #120 | Excellent 47.5% |