Syrian vs Alaskan Athabascan Currently Married
COMPARE
Syrian
Alaskan Athabascan
Currently Married
Currently Married Comparison
Syrians
Alaskan Athabascans
47.5%
CURRENTLY MARRIED
88.9/ 100
METRIC RATING
120th/ 347
METRIC RANK
44.6%
CURRENTLY MARRIED
0.9/ 100
METRIC RATING
235th/ 347
METRIC RANK
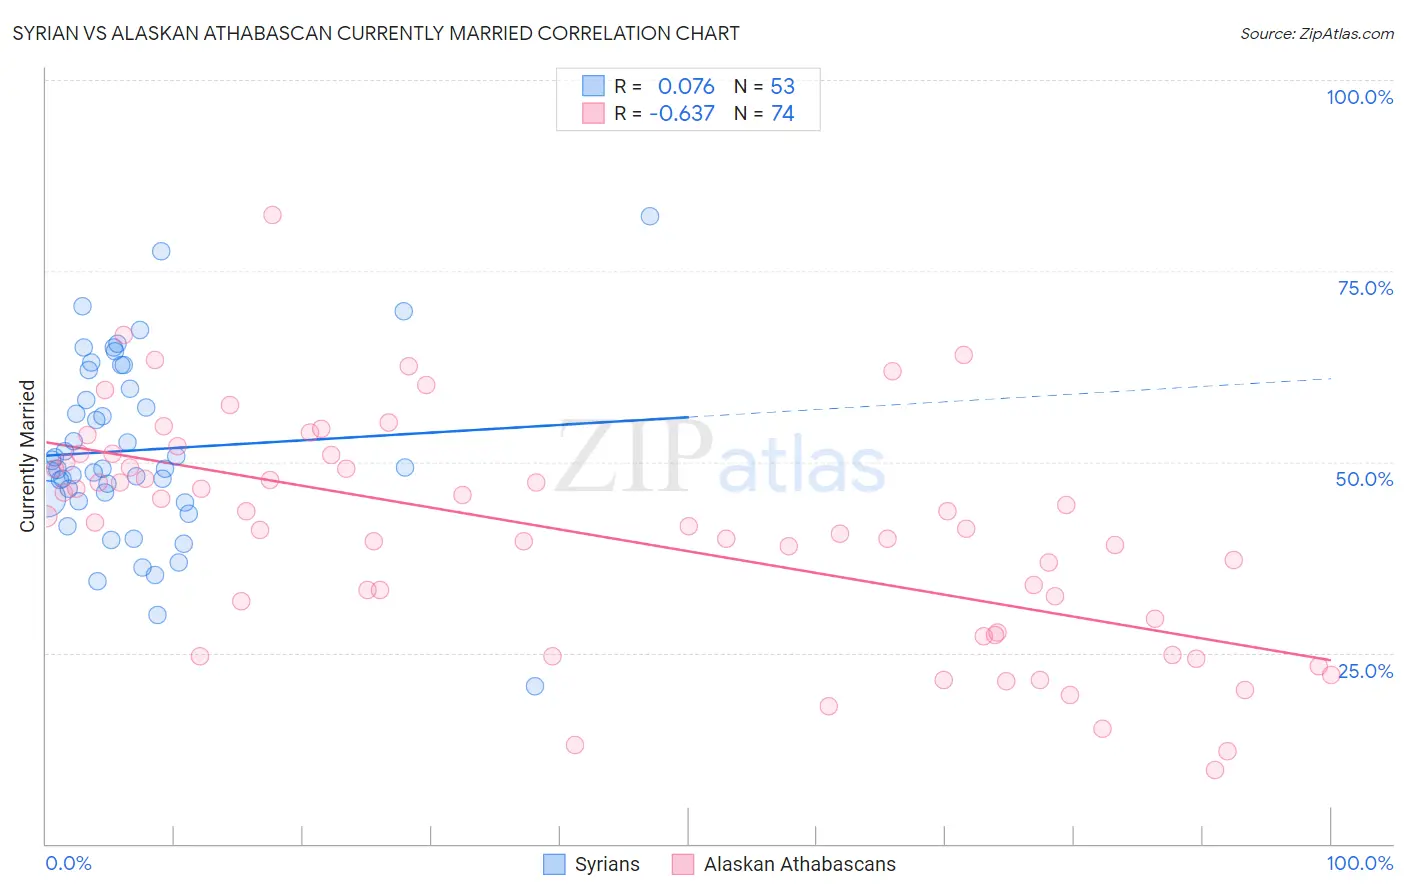
Syrian vs Alaskan Athabascan Currently Married Correlation Chart
The statistical analysis conducted on geographies consisting of 266,298,061 people shows a slight positive correlation between the proportion of Syrians and percentage of population currently married in the United States with a correlation coefficient (R) of 0.076 and weighted average of 47.5%. Similarly, the statistical analysis conducted on geographies consisting of 45,820,219 people shows a significant negative correlation between the proportion of Alaskan Athabascans and percentage of population currently married in the United States with a correlation coefficient (R) of -0.637 and weighted average of 44.6%, a difference of 6.4%.
Currently Married Correlation Summary
| Measurement | Syrian | Alaskan Athabascan |
| Minimum | 20.6% | 9.6% |
| Maximum | 82.1% | 82.4% |
| Range | 61.5% | 72.8% |
| Mean | 51.6% | 40.6% |
| Median | 49.1% | 41.9% |
| Interquartile 25% (IQ1) | 45.0% | 27.7% |
| Interquartile 75% (IQ3) | 60.8% | 49.9% |
| Interquartile Range (IQR) | 15.7% | 22.2% |
| Standard Deviation (Sample) | 11.8% | 14.7% |
| Standard Deviation (Population) | 11.7% | 14.6% |
Similar Demographics by Currently Married
Demographics Similar to Syrians by Currently Married
In terms of currently married, the demographic groups most similar to Syrians are Immigrants from Croatia (47.5%, a difference of 0.030%), Osage (47.5%, a difference of 0.090%), Immigrants from Philippines (47.6%, a difference of 0.12%), Australian (47.6%, a difference of 0.12%), and Puget Sound Salish (47.6%, a difference of 0.13%).
| Demographics | Rating | Rank | Currently Married |
| Immigrants | Denmark | 90.9 /100 | #113 | Exceptional 47.6% |
| South Africans | 90.5 /100 | #114 | Exceptional 47.6% |
| Immigrants | Indonesia | 90.5 /100 | #115 | Exceptional 47.6% |
| Palestinians | 90.4 /100 | #116 | Exceptional 47.6% |
| Puget Sound Salish | 90.3 /100 | #117 | Exceptional 47.6% |
| Immigrants | Philippines | 90.2 /100 | #118 | Exceptional 47.6% |
| Australians | 90.2 /100 | #119 | Exceptional 47.6% |
| Syrians | 88.9 /100 | #120 | Excellent 47.5% |
| Immigrants | Croatia | 88.6 /100 | #121 | Excellent 47.5% |
| Osage | 87.9 /100 | #122 | Excellent 47.5% |
| Immigrants | Kazakhstan | 87.2 /100 | #123 | Excellent 47.4% |
| Laotians | 86.6 /100 | #124 | Excellent 47.4% |
| Okinawans | 85.3 /100 | #125 | Excellent 47.4% |
| Immigrants | Jordan | 84.9 /100 | #126 | Excellent 47.4% |
| New Zealanders | 84.9 /100 | #127 | Excellent 47.4% |
Demographics Similar to Alaskan Athabascans by Currently Married
In terms of currently married, the demographic groups most similar to Alaskan Athabascans are Cuban (44.6%, a difference of 0.010%), Seminole (44.6%, a difference of 0.010%), Moroccan (44.6%, a difference of 0.090%), Immigrants from Saudi Arabia (44.7%, a difference of 0.16%), and Iroquois (44.7%, a difference of 0.16%).
| Demographics | Rating | Rank | Currently Married |
| Immigrants | Uruguay | 2.0 /100 | #228 | Tragic 45.0% |
| Cree | 1.7 /100 | #229 | Tragic 44.9% |
| Immigrants | Kenya | 1.6 /100 | #230 | Tragic 44.9% |
| Immigrants | Panama | 1.5 /100 | #231 | Tragic 44.9% |
| Nepalese | 1.2 /100 | #232 | Tragic 44.7% |
| Immigrants | Saudi Arabia | 1.1 /100 | #233 | Tragic 44.7% |
| Iroquois | 1.1 /100 | #234 | Tragic 44.7% |
| Alaskan Athabascans | 0.9 /100 | #235 | Tragic 44.6% |
| Cubans | 0.9 /100 | #236 | Tragic 44.6% |
| Seminole | 0.9 /100 | #237 | Tragic 44.6% |
| Moroccans | 0.9 /100 | #238 | Tragic 44.6% |
| Immigrants | Mexico | 0.7 /100 | #239 | Tragic 44.5% |
| Mexican American Indians | 0.7 /100 | #240 | Tragic 44.5% |
| Ethiopians | 0.7 /100 | #241 | Tragic 44.5% |
| Immigrants | Cambodia | 0.7 /100 | #242 | Tragic 44.5% |