Sri Lankan vs Cajun Family Households

COMPARE

Sri Lankan
Race
Ancestry
AfghanAfricanAlaska NativeAlaskan AthabascanAlbanianAleutAlsatianAmericanApacheArabArapahoArgentineanArmenianAssyrian/Chaldean/SyriacAustralianAustrianBahamianBangladeshiBarbadianBasqueBelgianBelizeanBermudanBhutaneseBlackfeetBolivianBrazilianBritishBritish West IndianBulgarianBurmeseCambodianCanadianCape VerdeanCarpatho RusynCelticCentral AmericanCentral American IndianCherokeeCheyenneChickasawChileanChineseChippewaChoctawColombianColvilleComancheCosta RicanCreeCreekCroatianCrowCubanCypriotCzechCzechoslovakianDanishDelawareDominicanDutchDutch West IndianEastern EuropeanEcuadorianEgyptianEnglishEstonianEthiopianEuropeanFijianFilipinoFinnishFrenchFrench American IndianFrench CanadianGermanGerman RussianGhanaianGreekGuamanian/ChamorroGuatemalanGuyaneseHaitianHmongHonduranHopiHoumaHungarianIcelanderIndian (Asian)IndonesianInupiatIranianIraqiIrishIroquoisIsraeliItalianJamaicanJapaneseJordanianKenyanKiowaKoreanLaotianLatvianLebaneseLiberianLithuanianLumbeeLuxembourgerMacedonianMalaysianMalteseMarshalleseMenomineeMexicanMexican American IndianMongolianMoroccanNative HawaiianNavajoNepaleseNew ZealanderNicaraguanNigerianNorthern EuropeanNorwegianOkinawanOsageOttawaPaiutePakistaniPalestinianPanamanianParaguayanPennsylvania GermanPeruvianPimaPolishPortuguesePotawatomiPuebloPuerto RicanPuget Sound SalishRomanianRussianSalvadoranSamoanScandinavianScotch-IrishScottishSeminoleSenegaleseSerbianShoshoneSierra LeoneanSiouxSlavicSlovakSloveneSomaliSouth AfricanSouth AmericanSouth American IndianSoviet UnionSpaniardSpanishSpanish AmericanSpanish American IndianSri LankanSubsaharan AfricanSudaneseSwedishSwissSyrianTaiwaneseThaiTlingit-HaidaTohono O'OdhamTonganTrinidadian and TobagonianTsimshianTurkishU.S. Virgin IslanderUgandanUkrainianUruguayanUteVenezuelanVietnameseWelshWest IndianYakamaYaquiYugoslavianYumanYup'ikZimbabwean
Immigration
NonimmigrantsImmigrantsAfghanistanAfricaAlbaniaArgentinaArmeniaAsiaAustraliaAustriaBahamasBangladeshBarbadosBelarusBelgiumBelizeBoliviaBosnia and HerzegovinaBrazilBulgariaBurma/MyanmarCabo VerdeCambodiaCameroonCanadaCaribbeanCentral AmericaChileChinaColombiaCongoCosta RicaCroatiaCubaCzechoslovakiaDenmarkDominicaDominican RepublicEastern AfricaEastern AsiaEastern EuropeEcuadorEgyptEl SalvadorEnglandEritreaEthiopiaEuropeFijiFranceGermanyGhanaGreeceGrenadaGuatemalaGuyanaHaitiHondurasHong KongHungaryIndiaIndonesiaIranIraqIrelandIsraelItalyJamaicaJapanJordanKazakhstanKenyaKoreaKuwaitLaosLatin AmericaLatviaLebanonLiberiaLithuaniaMalaysiaMexicoMicronesiaMiddle AfricaMoldovaMoroccoNepalNetherlandsNicaraguaNigeriaNorth AmericaNorth MacedoniaNorthern AfricaNorthern EuropeNorwayOceaniaPakistanPanamaPeruPhilippinesPolandPortugalRomaniaRussiaSaudi ArabiaScotlandSenegalSerbiaSierra LeoneSingaporeSomaliaSouth AfricaSouth AmericaSouth Central AsiaSouth Eastern AsiaSouthern EuropeSpainSri LankaSt. Vincent and the GrenadinesSudanSwedenSwitzerlandSyriaTaiwanThailandTrinidad and TobagoTurkeyUgandaUkraineUruguayUzbekistanVenezuelaVietnamWest IndiesWestern AfricaWestern AsiaWestern EuropeYemenZaireZimbabweAzores
Cajun
Race
Ancestry
AfghanAfricanAlaska NativeAlaskan AthabascanAlbanianAleutAlsatianAmericanApacheArabArapahoArgentineanArmenianAssyrian/Chaldean/SyriacAustralianAustrianBahamianBangladeshiBarbadianBasqueBelgianBelizeanBermudanBhutaneseBlackfeetBolivianBrazilianBritishBritish West IndianBulgarianBurmeseCajunCambodianCanadianCape VerdeanCarpatho RusynCelticCentral AmericanCentral American IndianCherokeeCheyenneChickasawChileanChineseChippewaChoctawColombianColvilleComancheCosta RicanCreeCreekCroatianCrowCubanCypriotCzechCzechoslovakianDanishDelawareDominicanDutchDutch West IndianEastern EuropeanEcuadorianEgyptianEnglishEstonianEthiopianEuropeanFijianFilipinoFinnishFrenchFrench American IndianFrench CanadianGermanGerman RussianGhanaianGreekGuamanian/ChamorroGuatemalanGuyaneseHaitianHmongHonduranHopiHoumaHungarianIcelanderIndian (Asian)IndonesianInupiatIranianIraqiIrishIroquoisIsraeliItalianJamaicanJapaneseJordanianKenyanKiowaKoreanLaotianLatvianLebaneseLiberianLithuanianLumbeeLuxembourgerMacedonianMalaysianMalteseMarshalleseMenomineeMexicanMexican American IndianMongolianMoroccanNative HawaiianNavajoNepaleseNew ZealanderNicaraguanNigerianNorthern EuropeanNorwegianOkinawanOsageOttawaPaiutePakistaniPalestinianPanamanianParaguayanPennsylvania GermanPeruvianPimaPolishPortuguesePotawatomiPuebloPuerto RicanPuget Sound SalishRomanianRussianSalvadoranSamoanScandinavianScotch-IrishScottishSeminoleSenegaleseSerbianShoshoneSierra LeoneanSiouxSlavicSlovakSloveneSomaliSouth AfricanSouth AmericanSouth American IndianSoviet UnionSpaniardSpanishSpanish AmericanSpanish American IndianSubsaharan AfricanSudaneseSwedishSwissSyrianTaiwaneseThaiTlingit-HaidaTohono O'OdhamTonganTrinidadian and TobagonianTsimshianTurkishU.S. Virgin IslanderUgandanUkrainianUruguayanUteVenezuelanVietnameseWelshWest IndianYakamaYaquiYugoslavianYumanYup'ikZimbabwean
Immigration
NonimmigrantsImmigrantsAfghanistanAfricaAlbaniaArgentinaArmeniaAsiaAustraliaAustriaBahamasBangladeshBarbadosBelarusBelgiumBelizeBoliviaBosnia and HerzegovinaBrazilBulgariaBurma/MyanmarCabo VerdeCambodiaCameroonCanadaCaribbeanCentral AmericaChileChinaColombiaCongoCosta RicaCroatiaCubaCzechoslovakiaDenmarkDominicaDominican RepublicEastern AfricaEastern AsiaEastern EuropeEcuadorEgyptEl SalvadorEnglandEritreaEthiopiaEuropeFijiFranceGermanyGhanaGreeceGrenadaGuatemalaGuyanaHaitiHondurasHong KongHungaryIndiaIndonesiaIranIraqIrelandIsraelItalyJamaicaJapanJordanKazakhstanKenyaKoreaKuwaitLaosLatin AmericaLatviaLebanonLiberiaLithuaniaMalaysiaMexicoMicronesiaMiddle AfricaMoldovaMoroccoNepalNetherlandsNicaraguaNigeriaNorth AmericaNorth MacedoniaNorthern AfricaNorthern EuropeNorwayOceaniaPakistanPanamaPeruPhilippinesPolandPortugalRomaniaRussiaSaudi ArabiaScotlandSenegalSerbiaSierra LeoneSingaporeSomaliaSouth AfricaSouth AmericaSouth Central AsiaSouth Eastern AsiaSouthern EuropeSpainSri LankaSt. Vincent and the GrenadinesSudanSwedenSwitzerlandSyriaTaiwanThailandTrinidad and TobagoTurkeyUgandaUkraineUruguayUzbekistanVenezuelaVietnamWest IndiesWestern AfricaWestern AsiaWestern EuropeYemenZaireZimbabweAzores
Family Households
Income
Poverty
Unemployment
Labor Participation
Family Structure
Vehicle Availability
Education Level
Disability

Family Households Comparison

Sri Lankans

Cajuns

Exceptional
Excellent
67.7%
FAMILY HOUSEHOLDS
100.0/ 100
METRIC RATING
22nd/ 347
METRIC RANK
64.8%
FAMILY HOUSEHOLDS
89.4/ 100
METRIC RATING
132nd/ 347
METRIC RANK

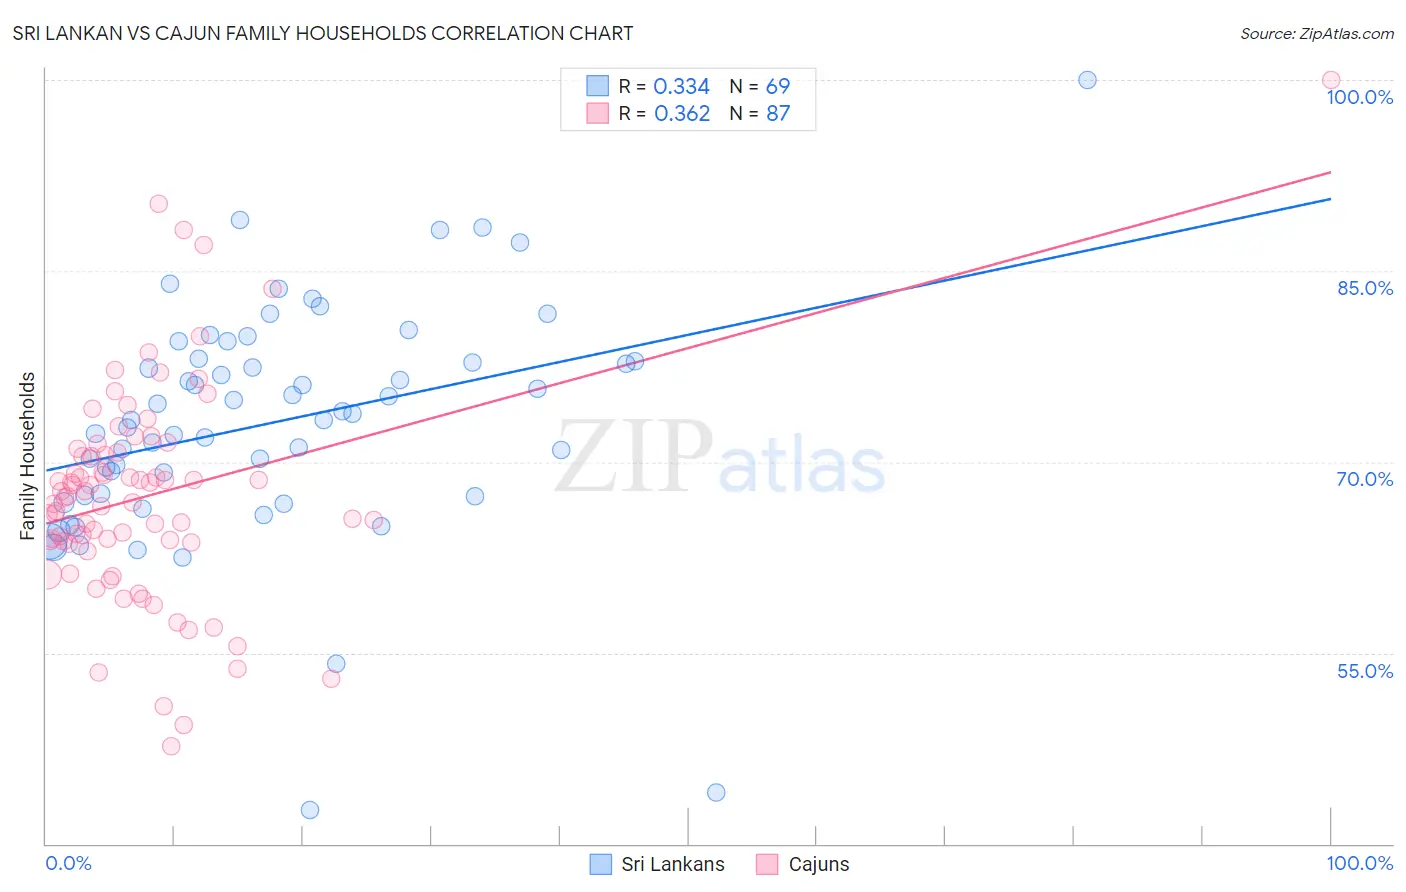
Sri Lankan vs Cajun Family Households Correlation Chart

The statistical analysis conducted on geographies consisting of 440,096,493 people shows a mild positive correlation between the proportion of Sri Lankans and percentage of family households in the United States with a correlation coefficient (R) of 0.334 and weighted average of 67.7%. Similarly, the statistical analysis conducted on geographies consisting of 149,695,707 people shows a mild positive correlation between the proportion of Cajuns and percentage of family households in the United States with a correlation coefficient (R) of 0.362 and weighted average of 64.8%, a difference of 4.6%.
Sri Lankan vs Cajun Family Households

Family Households Correlation Summary

MeasurementSri LankanCajun
Minimum42.7%47.6%
Maximum100.0%100.0%
Range57.3%52.4%
Mean73.1%67.3%
Median73.3%67.2%
Interquartile 25% (IQ1)67.3%63.6%
Interquartile 75% (IQ3)78.0%70.7%
Interquartile Range (IQR)10.7%7.1%
Standard Deviation (Sample)9.3%8.6%
Standard Deviation (Population)9.2%8.6%

Similar Demographics by Family Households

Demographics Similar to Sri Lankans by Family Households

In terms of family households, the demographic groups most similar to Sri Lankans are Cuban (67.7%, a difference of 0.040%), Inupiat (67.8%, a difference of 0.090%), Immigrants from Pakistan (67.7%, a difference of 0.090%), Samoan (67.9%, a difference of 0.33%), and Immigrants from South Eastern Asia (67.5%, a difference of 0.37%).
DemographicsRating | RankFamily Households
Assyrians/Chaldeans/Syriacs
100.0
/100
|
#15
Exceptional
68.2%
Immigrants | Vietnam
100.0
/100
|
#16
Exceptional
68.2%
Chinese
100.0
/100
|
#17
Exceptional
68.1%
Immigrants | Taiwan
100.0
/100
|
#18
Exceptional
68.0%
Samoans
100.0
/100
|
#19
Exceptional
67.9%
Inupiat
100.0
/100
|
#20
Exceptional
67.8%
Cubans
100.0
/100
|
#21
Exceptional
67.7%
Sri Lankans
100.0
/100
|
#22
Exceptional
67.7%
Immigrants | Pakistan
100.0
/100
|
#23
Exceptional
67.7%
Immigrants | South Eastern Asia
100.0
/100
|
#24
Exceptional
67.5%
Immigrants | Nicaragua
100.0
/100
|
#25
Exceptional
67.5%
Immigrants | India
100.0
/100
|
#26
Exceptional
67.4%
Hispanics or Latinos
100.0
/100
|
#27
Exceptional
67.4%
Hawaiians
100.0
/100
|
#28
Exceptional
67.4%
Nicaraguans
100.0
/100
|
#29
Exceptional
67.4%

Demographics Similar to Cajuns by Family Households

In terms of family households, the demographic groups most similar to Cajuns are Belizean (64.8%, a difference of 0.0%), Nonimmigrants (64.8%, a difference of 0.020%), Immigrants from Italy (64.8%, a difference of 0.030%), Greek (64.7%, a difference of 0.040%), and Maltese (64.7%, a difference of 0.060%).
DemographicsRating | RankFamily Households
Immigrants | Belize
92.7
/100
|
#125
Exceptional
64.9%
Panamanians
92.4
/100
|
#126
Exceptional
64.8%
Immigrants | Panama
92.0
/100
|
#127
Exceptional
64.8%
Italians
91.9
/100
|
#128
Exceptional
64.8%
Immigrants | Ecuador
91.4
/100
|
#129
Exceptional
64.8%
Immigrants | Italy
90.2
/100
|
#130
Exceptional
64.8%
Immigrants | Nonimmigrants
90.1
/100
|
#131
Exceptional
64.8%
Cajuns
89.4
/100
|
#132
Excellent
64.8%
Belizeans
89.3
/100
|
#133
Excellent
64.8%
Greeks
88.1
/100
|
#134
Excellent
64.7%
Maltese
87.4
/100
|
#135
Excellent
64.7%
Immigrants | China
86.6
/100
|
#136
Excellent
64.7%
Immigrants | Scotland
86.4
/100
|
#137
Excellent
64.7%
Basques
85.5
/100
|
#138
Excellent
64.7%
Immigrants | Jamaica
85.3
/100
|
#139
Excellent
64.7%