South American Indian vs Hawaiian Births to Unmarried Women
COMPARE
South American Indian
Hawaiian
Births to Unmarried Women
Births to Unmarried Women Comparison
South American Indians
Hawaiians
31.7%
BIRTHS TO UNMARRIED WOMEN
47.7/ 100
METRIC RATING
177th/ 347
METRIC RANK
33.2%
BIRTHS TO UNMARRIED WOMEN
11.3/ 100
METRIC RATING
208th/ 347
METRIC RANK
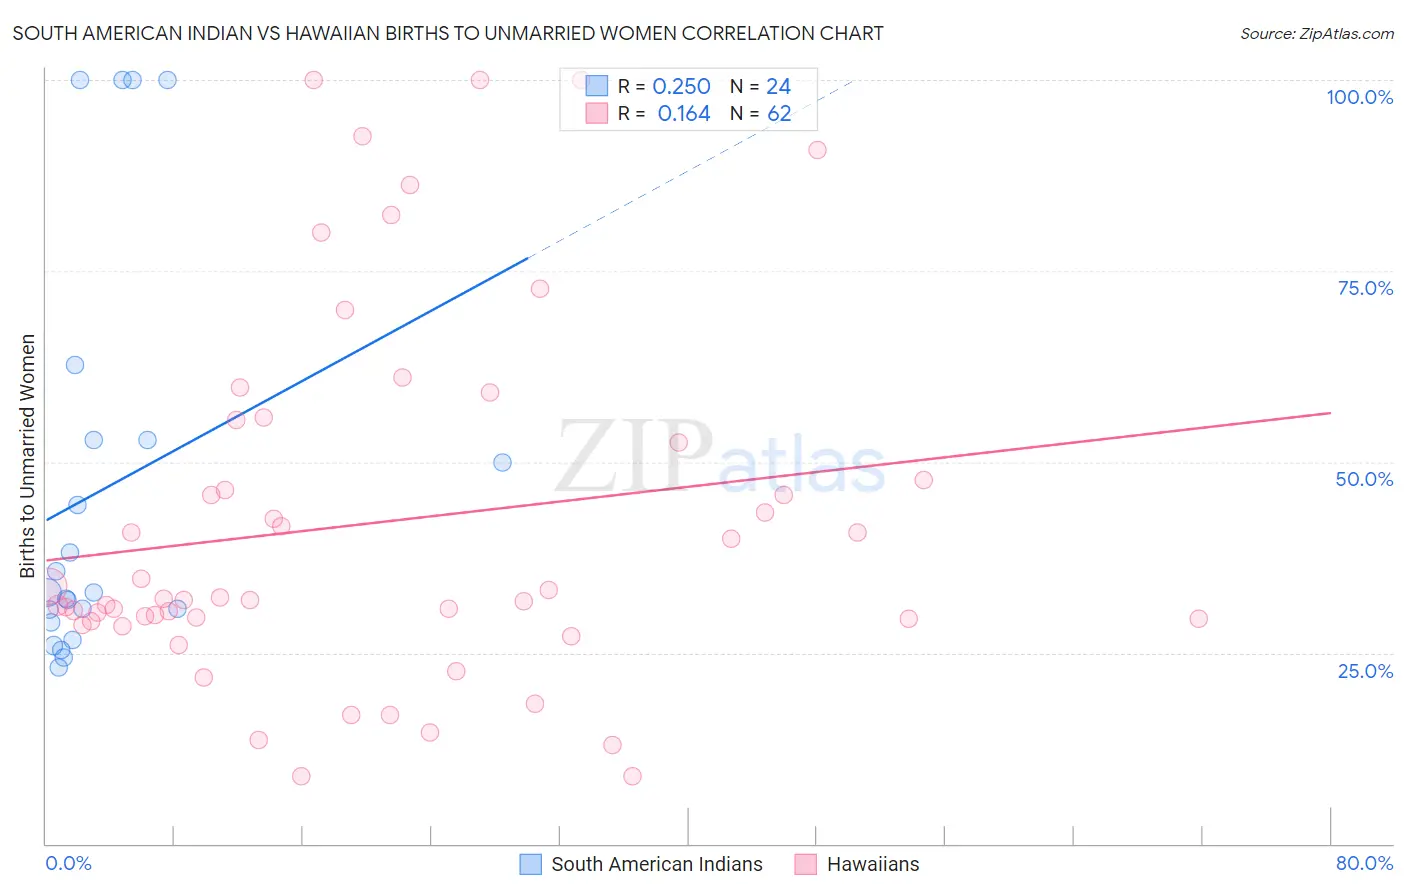
South American Indian vs Hawaiian Births to Unmarried Women Correlation Chart
The statistical analysis conducted on geographies consisting of 159,564,044 people shows a weak positive correlation between the proportion of South American Indians and percentage of births to unmarried women in the United States with a correlation coefficient (R) of 0.250 and weighted average of 31.7%. Similarly, the statistical analysis conducted on geographies consisting of 312,224,673 people shows a poor positive correlation between the proportion of Hawaiians and percentage of births to unmarried women in the United States with a correlation coefficient (R) of 0.164 and weighted average of 33.2%, a difference of 4.6%.
Births to Unmarried Women Correlation Summary
| Measurement | South American Indian | Hawaiian |
| Minimum | 23.0% | 8.9% |
| Maximum | 100.0% | 100.0% |
| Range | 77.0% | 91.1% |
| Mean | 46.4% | 42.0% |
| Median | 32.9% | 31.9% |
| Interquartile 25% (IQ1) | 29.9% | 29.4% |
| Interquartile 75% (IQ3) | 52.9% | 52.6% |
| Interquartile Range (IQR) | 23.0% | 23.2% |
| Standard Deviation (Sample) | 26.5% | 23.6% |
| Standard Deviation (Population) | 25.9% | 23.4% |
Similar Demographics by Births to Unmarried Women
Demographics Similar to South American Indians by Births to Unmarried Women
In terms of births to unmarried women, the demographic groups most similar to South American Indians are English (31.7%, a difference of 0.030%), Scottish (31.7%, a difference of 0.040%), South American (31.8%, a difference of 0.070%), Immigrants from Venezuela (31.7%, a difference of 0.14%), and Moroccan (31.8%, a difference of 0.18%).
| Demographics | Rating | Rank | Births to Unmarried Women |
| Guamanians/Chamorros | 51.3 /100 | #170 | Average 31.6% |
| Finns | 50.5 /100 | #171 | Average 31.7% |
| Immigrants | Eritrea | 50.4 /100 | #172 | Average 31.7% |
| Immigrants | Yemen | 50.2 /100 | #173 | Average 31.7% |
| Venezuelans | 50.0 /100 | #174 | Average 31.7% |
| Immigrants | Venezuela | 49.2 /100 | #175 | Average 31.7% |
| Scottish | 48.1 /100 | #176 | Average 31.7% |
| South American Indians | 47.7 /100 | #177 | Average 31.7% |
| English | 47.4 /100 | #178 | Average 31.7% |
| South Americans | 46.9 /100 | #179 | Average 31.8% |
| Moroccans | 45.7 /100 | #180 | Average 31.8% |
| Immigrants | Peru | 45.1 /100 | #181 | Average 31.8% |
| Kenyans | 43.0 /100 | #182 | Average 31.9% |
| Canadians | 41.4 /100 | #183 | Average 31.9% |
| Immigrants | South America | 40.7 /100 | #184 | Average 32.0% |
Demographics Similar to Hawaiians by Births to Unmarried Women
In terms of births to unmarried women, the demographic groups most similar to Hawaiians are Immigrants from Sudan (33.2%, a difference of 0.030%), White/Caucasian (33.3%, a difference of 0.14%), Scotch-Irish (33.3%, a difference of 0.14%), Ecuadorian (33.3%, a difference of 0.19%), and Celtic (33.3%, a difference of 0.25%).
| Demographics | Rating | Rank | Births to Unmarried Women |
| Immigrants | Burma/Myanmar | 16.7 /100 | #201 | Poor 32.9% |
| Immigrants | Micronesia | 16.6 /100 | #202 | Poor 32.9% |
| Ute | 14.4 /100 | #203 | Poor 33.0% |
| Immigrants | Africa | 14.3 /100 | #204 | Poor 33.0% |
| German Russians | 13.1 /100 | #205 | Poor 33.1% |
| Uruguayans | 12.8 /100 | #206 | Poor 33.1% |
| Immigrants | Sudan | 11.5 /100 | #207 | Poor 33.2% |
| Hawaiians | 11.3 /100 | #208 | Poor 33.2% |
| Whites/Caucasians | 10.7 /100 | #209 | Poor 33.3% |
| Scotch-Irish | 10.7 /100 | #210 | Poor 33.3% |
| Ecuadorians | 10.5 /100 | #211 | Poor 33.3% |
| Celtics | 10.2 /100 | #212 | Poor 33.3% |
| Immigrants | Costa Rica | 9.5 /100 | #213 | Tragic 33.4% |
| Slovaks | 9.3 /100 | #214 | Tragic 33.4% |
| French | 8.7 /100 | #215 | Tragic 33.4% |