South American Indian vs Black/African American Births to Unmarried Women
COMPARE
South American Indian
Black/African American
Births to Unmarried Women
Births to Unmarried Women Comparison
South American Indians
Blacks/African Americans
31.7%
BIRTHS TO UNMARRIED WOMEN
47.7/ 100
METRIC RATING
177th/ 347
METRIC RANK
44.3%
BIRTHS TO UNMARRIED WOMEN
0.0/ 100
METRIC RATING
333rd/ 347
METRIC RANK
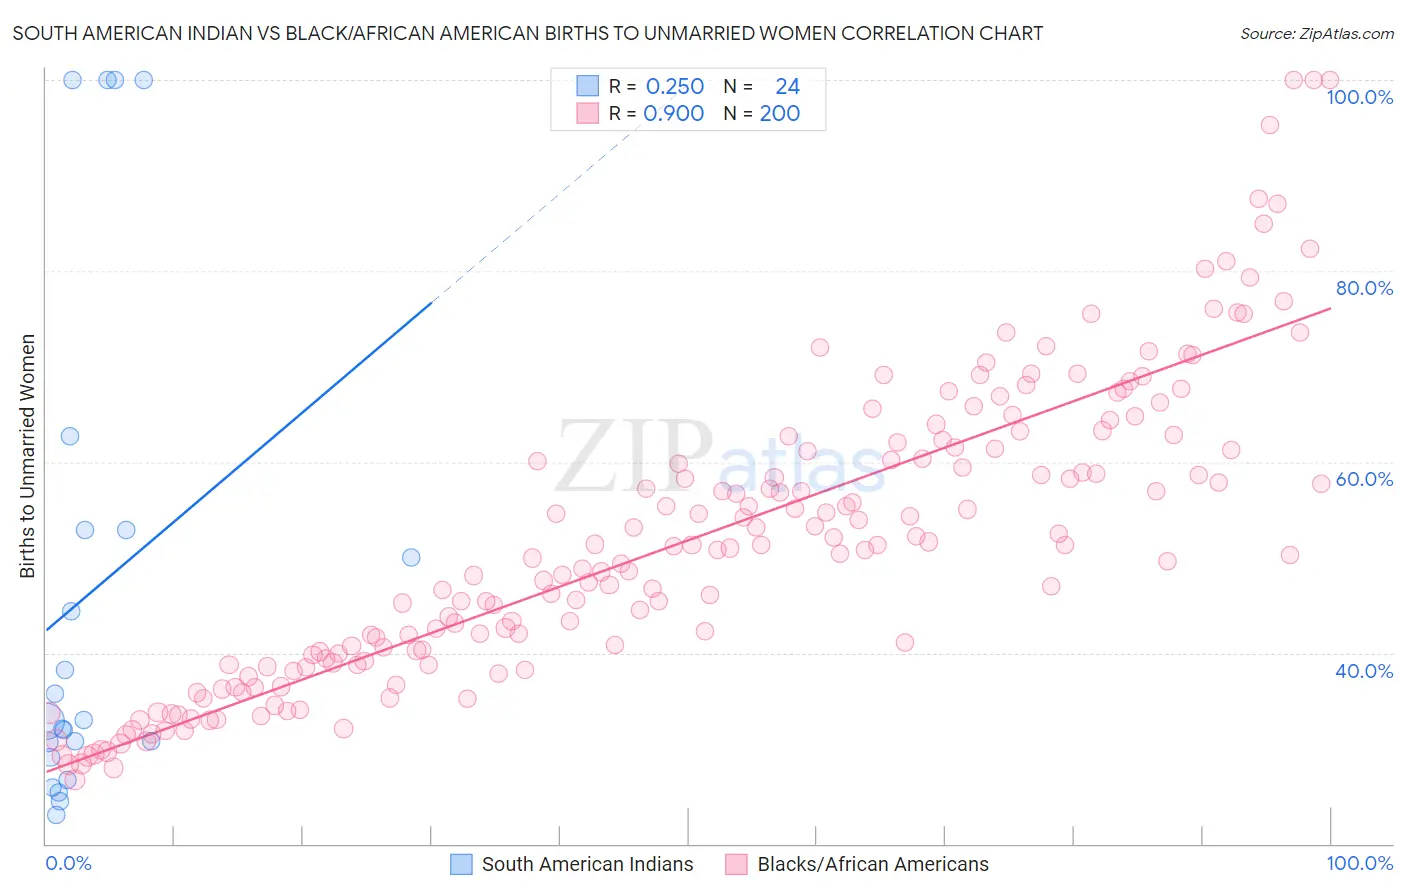
South American Indian vs Black/African American Births to Unmarried Women Correlation Chart
The statistical analysis conducted on geographies consisting of 159,564,044 people shows a weak positive correlation between the proportion of South American Indians and percentage of births to unmarried women in the United States with a correlation coefficient (R) of 0.250 and weighted average of 31.7%. Similarly, the statistical analysis conducted on geographies consisting of 506,152,506 people shows a very strong positive correlation between the proportion of Blacks/African Americans and percentage of births to unmarried women in the United States with a correlation coefficient (R) of 0.900 and weighted average of 44.3%, a difference of 39.6%.
Births to Unmarried Women Correlation Summary
| Measurement | South American Indian | Black/African American |
| Minimum | 23.0% | 26.7% |
| Maximum | 100.0% | 100.0% |
| Range | 77.0% | 73.3% |
| Mean | 46.4% | 51.8% |
| Median | 32.9% | 50.9% |
| Interquartile 25% (IQ1) | 29.9% | 39.1% |
| Interquartile 75% (IQ3) | 52.9% | 61.4% |
| Interquartile Range (IQR) | 23.0% | 22.4% |
| Standard Deviation (Sample) | 26.5% | 15.6% |
| Standard Deviation (Population) | 25.9% | 15.6% |
Similar Demographics by Births to Unmarried Women
Demographics Similar to South American Indians by Births to Unmarried Women
In terms of births to unmarried women, the demographic groups most similar to South American Indians are English (31.7%, a difference of 0.030%), Scottish (31.7%, a difference of 0.040%), South American (31.8%, a difference of 0.070%), Immigrants from Venezuela (31.7%, a difference of 0.14%), and Moroccan (31.8%, a difference of 0.18%).
| Demographics | Rating | Rank | Births to Unmarried Women |
| Guamanians/Chamorros | 51.3 /100 | #170 | Average 31.6% |
| Finns | 50.5 /100 | #171 | Average 31.7% |
| Immigrants | Eritrea | 50.4 /100 | #172 | Average 31.7% |
| Immigrants | Yemen | 50.2 /100 | #173 | Average 31.7% |
| Venezuelans | 50.0 /100 | #174 | Average 31.7% |
| Immigrants | Venezuela | 49.2 /100 | #175 | Average 31.7% |
| Scottish | 48.1 /100 | #176 | Average 31.7% |
| South American Indians | 47.7 /100 | #177 | Average 31.7% |
| English | 47.4 /100 | #178 | Average 31.7% |
| South Americans | 46.9 /100 | #179 | Average 31.8% |
| Moroccans | 45.7 /100 | #180 | Average 31.8% |
| Immigrants | Peru | 45.1 /100 | #181 | Average 31.8% |
| Kenyans | 43.0 /100 | #182 | Average 31.9% |
| Canadians | 41.4 /100 | #183 | Average 31.9% |
| Immigrants | South America | 40.7 /100 | #184 | Average 32.0% |
Demographics Similar to Blacks/African Americans by Births to Unmarried Women
In terms of births to unmarried women, the demographic groups most similar to Blacks/African Americans are Yuman (44.4%, a difference of 0.17%), Colville (45.3%, a difference of 2.3%), Kiowa (43.1%, a difference of 2.7%), Native/Alaskan (43.0%, a difference of 3.0%), and Puerto Rican (45.7%, a difference of 3.1%).
| Demographics | Rating | Rank | Births to Unmarried Women |
| Immigrants | Cuba | 0.0 /100 | #326 | Tragic 41.5% |
| Tsimshian | 0.0 /100 | #327 | Tragic 42.2% |
| Immigrants | Cabo Verde | 0.0 /100 | #328 | Tragic 42.2% |
| Paiute | 0.0 /100 | #329 | Tragic 42.5% |
| Chippewa | 0.0 /100 | #330 | Tragic 42.6% |
| Natives/Alaskans | 0.0 /100 | #331 | Tragic 43.0% |
| Kiowa | 0.0 /100 | #332 | Tragic 43.1% |
| Blacks/African Americans | 0.0 /100 | #333 | Tragic 44.3% |
| Yuman | 0.0 /100 | #334 | Tragic 44.4% |
| Colville | 0.0 /100 | #335 | Tragic 45.3% |
| Puerto Ricans | 0.0 /100 | #336 | Tragic 45.7% |
| Houma | 0.0 /100 | #337 | Tragic 46.6% |
| Arapaho | 0.0 /100 | #338 | Tragic 47.1% |
| Lumbee | 0.0 /100 | #339 | Tragic 48.2% |
| Tohono O'odham | 0.0 /100 | #340 | Tragic 49.8% |