Slovene vs Bangladeshi Family Households with Children
COMPARE
Slovene
Bangladeshi
Family Households with Children
Family Households with Children Comparison
Slovenes
Bangladeshis
25.8%
FAMILY HOUSEHOLDS WITH CHILDREN
0.0/ 100
METRIC RATING
331st/ 347
METRIC RANK
30.1%
FAMILY HOUSEHOLDS WITH CHILDREN
100.0/ 100
METRIC RATING
14th/ 347
METRIC RANK
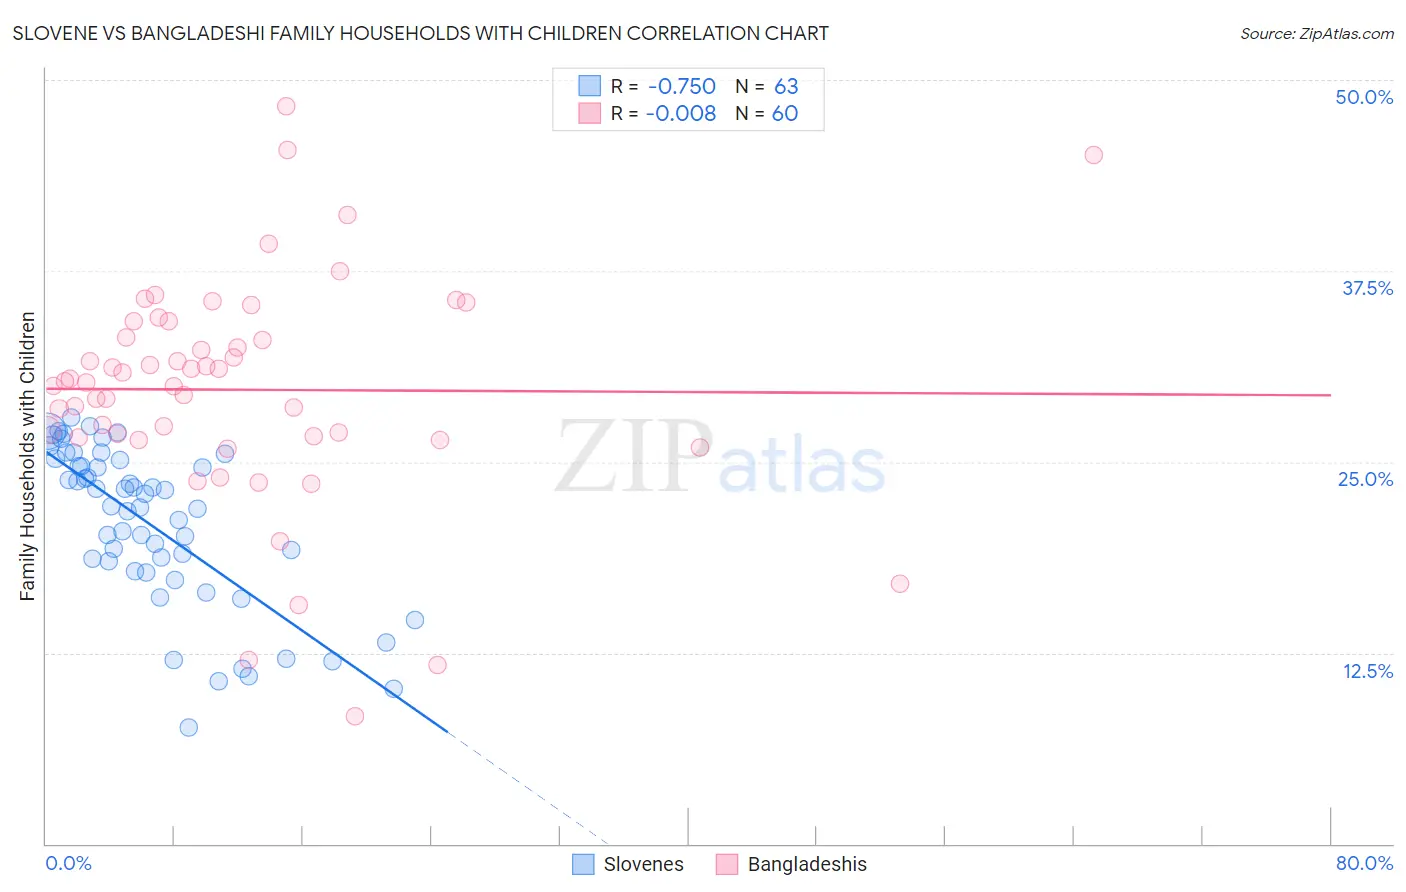
Slovene vs Bangladeshi Family Households with Children Correlation Chart
The statistical analysis conducted on geographies consisting of 261,178,360 people shows a strong negative correlation between the proportion of Slovenes and percentage of family households with children in the United States with a correlation coefficient (R) of -0.750 and weighted average of 25.8%. Similarly, the statistical analysis conducted on geographies consisting of 141,328,833 people shows no correlation between the proportion of Bangladeshis and percentage of family households with children in the United States with a correlation coefficient (R) of -0.008 and weighted average of 30.1%, a difference of 16.6%.
Family Households with Children Correlation Summary
| Measurement | Slovene | Bangladeshi |
| Minimum | 7.6% | 8.3% |
| Maximum | 27.9% | 48.3% |
| Range | 20.3% | 39.9% |
| Mean | 20.9% | 29.7% |
| Median | 22.1% | 30.2% |
| Interquartile 25% (IQ1) | 17.8% | 26.6% |
| Interquartile 75% (IQ3) | 25.2% | 33.7% |
| Interquartile Range (IQR) | 7.4% | 7.1% |
| Standard Deviation (Sample) | 5.2% | 7.4% |
| Standard Deviation (Population) | 5.1% | 7.4% |
Similar Demographics by Family Households with Children
Demographics Similar to Slovenes by Family Households with Children
In terms of family households with children, the demographic groups most similar to Slovenes are Immigrants from Latvia (25.9%, a difference of 0.13%), Immigrants from Austria (25.8%, a difference of 0.23%), Cypriot (25.9%, a difference of 0.31%), Immigrants from Switzerland (25.7%, a difference of 0.31%), and Immigrants from Albania (25.9%, a difference of 0.44%).
| Demographics | Rating | Rank | Family Households with Children |
| Chinese | 0.0 /100 | #324 | Tragic 26.0% |
| Barbadians | 0.0 /100 | #325 | Tragic 26.0% |
| Immigrants | Ireland | 0.0 /100 | #326 | Tragic 26.0% |
| Immigrants | Barbados | 0.0 /100 | #327 | Tragic 26.0% |
| Immigrants | Albania | 0.0 /100 | #328 | Tragic 25.9% |
| Cypriots | 0.0 /100 | #329 | Tragic 25.9% |
| Immigrants | Latvia | 0.0 /100 | #330 | Tragic 25.9% |
| Slovenes | 0.0 /100 | #331 | Tragic 25.8% |
| Immigrants | Austria | 0.0 /100 | #332 | Tragic 25.8% |
| Immigrants | Switzerland | 0.0 /100 | #333 | Tragic 25.7% |
| Slovaks | 0.0 /100 | #334 | Tragic 25.7% |
| Immigrants | Croatia | 0.0 /100 | #335 | Tragic 25.7% |
| Immigrants | West Indies | 0.0 /100 | #336 | Tragic 25.7% |
| Puerto Ricans | 0.0 /100 | #337 | Tragic 25.6% |
| Arapaho | 0.0 /100 | #338 | Tragic 25.6% |
Demographics Similar to Bangladeshis by Family Households with Children
In terms of family households with children, the demographic groups most similar to Bangladeshis are Immigrants from South Central Asia (30.0%, a difference of 0.17%), Immigrants from Afghanistan (30.0%, a difference of 0.20%), Afghan (30.2%, a difference of 0.28%), Immigrants from Pakistan (30.2%, a difference of 0.52%), and Hispanic or Latino (29.9%, a difference of 0.58%).
| Demographics | Rating | Rank | Family Households with Children |
| Immigrants | Central America | 100.0 /100 | #7 | Exceptional 31.0% |
| Yakama | 100.0 /100 | #8 | Exceptional 30.8% |
| Thais | 100.0 /100 | #9 | Exceptional 30.6% |
| Immigrants | Fiji | 100.0 /100 | #10 | Exceptional 30.5% |
| Nepalese | 100.0 /100 | #11 | Exceptional 30.5% |
| Immigrants | Pakistan | 100.0 /100 | #12 | Exceptional 30.2% |
| Afghans | 100.0 /100 | #13 | Exceptional 30.2% |
| Bangladeshis | 100.0 /100 | #14 | Exceptional 30.1% |
| Immigrants | South Central Asia | 100.0 /100 | #15 | Exceptional 30.0% |
| Immigrants | Afghanistan | 100.0 /100 | #16 | Exceptional 30.0% |
| Hispanics or Latinos | 100.0 /100 | #17 | Exceptional 29.9% |
| Salvadorans | 100.0 /100 | #18 | Exceptional 29.9% |
| Alaska Natives | 100.0 /100 | #19 | Exceptional 29.9% |
| Immigrants | El Salvador | 100.0 /100 | #20 | Exceptional 29.8% |
| Immigrants | Laos | 100.0 /100 | #21 | Exceptional 29.8% |