Syrian vs Bangladeshi Family Households with Children
COMPARE
Syrian
Bangladeshi
Family Households with Children
Family Households with Children Comparison
Syrians
Bangladeshis
27.8%
FAMILY HOUSEHOLDS WITH CHILDREN
89.7/ 100
METRIC RATING
128th/ 347
METRIC RANK
30.1%
FAMILY HOUSEHOLDS WITH CHILDREN
100.0/ 100
METRIC RATING
14th/ 347
METRIC RANK
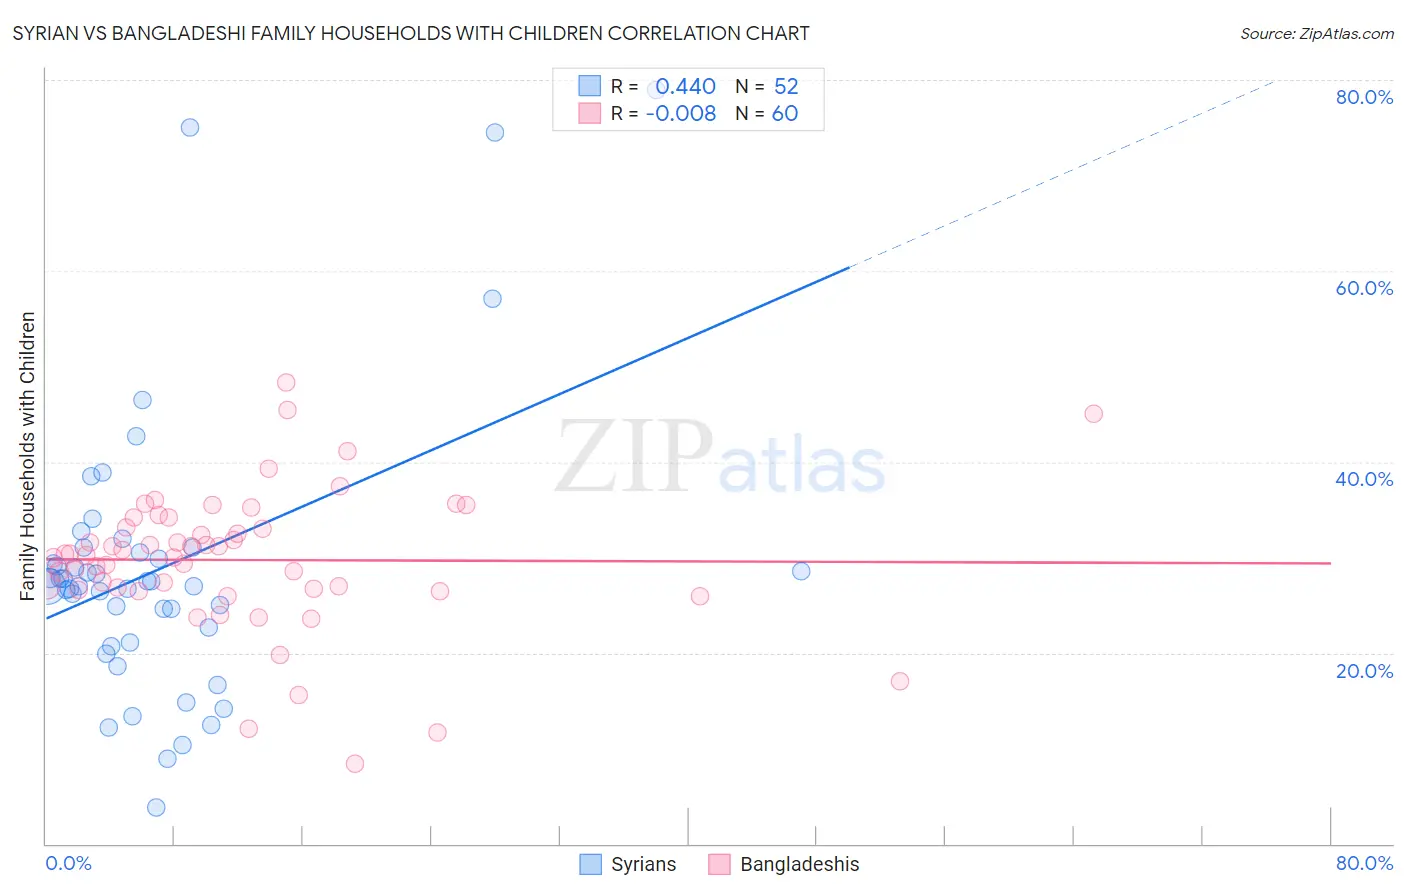
Syrian vs Bangladeshi Family Households with Children Correlation Chart
The statistical analysis conducted on geographies consisting of 266,095,178 people shows a moderate positive correlation between the proportion of Syrians and percentage of family households with children in the United States with a correlation coefficient (R) of 0.440 and weighted average of 27.8%. Similarly, the statistical analysis conducted on geographies consisting of 141,328,833 people shows no correlation between the proportion of Bangladeshis and percentage of family households with children in the United States with a correlation coefficient (R) of -0.008 and weighted average of 30.1%, a difference of 8.3%.
Family Households with Children Correlation Summary
| Measurement | Syrian | Bangladeshi |
| Minimum | 3.8% | 8.3% |
| Maximum | 78.9% | 48.3% |
| Range | 75.1% | 39.9% |
| Mean | 29.0% | 29.7% |
| Median | 27.2% | 30.2% |
| Interquartile 25% (IQ1) | 21.8% | 26.6% |
| Interquartile 75% (IQ3) | 30.8% | 33.7% |
| Interquartile Range (IQR) | 8.9% | 7.1% |
| Standard Deviation (Sample) | 15.0% | 7.4% |
| Standard Deviation (Population) | 14.8% | 7.4% |
Similar Demographics by Family Households with Children
Demographics Similar to Syrians by Family Households with Children
In terms of family households with children, the demographic groups most similar to Syrians are Belizean (27.8%, a difference of 0.020%), Immigrants from Eritrea (27.8%, a difference of 0.020%), Immigrants from Ethiopia (27.8%, a difference of 0.050%), Immigrants from Singapore (27.8%, a difference of 0.070%), and Ecuadorian (27.8%, a difference of 0.070%).
| Demographics | Rating | Rank | Family Households with Children |
| Immigrants | Western Asia | 93.6 /100 | #121 | Exceptional 27.9% |
| Immigrants | Zimbabwe | 92.8 /100 | #122 | Exceptional 27.8% |
| Immigrants | Northern Africa | 91.8 /100 | #123 | Exceptional 27.8% |
| Immigrants | Singapore | 90.8 /100 | #124 | Exceptional 27.8% |
| Ecuadorians | 90.8 /100 | #125 | Exceptional 27.8% |
| Immigrants | Ethiopia | 90.5 /100 | #126 | Exceptional 27.8% |
| Belizeans | 90.0 /100 | #127 | Exceptional 27.8% |
| Syrians | 89.7 /100 | #128 | Excellent 27.8% |
| Immigrants | Eritrea | 89.4 /100 | #129 | Excellent 27.8% |
| Cajuns | 87.6 /100 | #130 | Excellent 27.7% |
| Lebanese | 87.4 /100 | #131 | Excellent 27.7% |
| Immigrants | Belize | 85.7 /100 | #132 | Excellent 27.7% |
| Iranians | 85.2 /100 | #133 | Excellent 27.7% |
| Immigrants | Panama | 84.9 /100 | #134 | Excellent 27.7% |
| Immigrants | Ecuador | 84.6 /100 | #135 | Excellent 27.7% |
Demographics Similar to Bangladeshis by Family Households with Children
In terms of family households with children, the demographic groups most similar to Bangladeshis are Immigrants from South Central Asia (30.0%, a difference of 0.17%), Immigrants from Afghanistan (30.0%, a difference of 0.20%), Afghan (30.2%, a difference of 0.28%), Immigrants from Pakistan (30.2%, a difference of 0.52%), and Hispanic or Latino (29.9%, a difference of 0.58%).
| Demographics | Rating | Rank | Family Households with Children |
| Immigrants | Central America | 100.0 /100 | #7 | Exceptional 31.0% |
| Yakama | 100.0 /100 | #8 | Exceptional 30.8% |
| Thais | 100.0 /100 | #9 | Exceptional 30.6% |
| Immigrants | Fiji | 100.0 /100 | #10 | Exceptional 30.5% |
| Nepalese | 100.0 /100 | #11 | Exceptional 30.5% |
| Immigrants | Pakistan | 100.0 /100 | #12 | Exceptional 30.2% |
| Afghans | 100.0 /100 | #13 | Exceptional 30.2% |
| Bangladeshis | 100.0 /100 | #14 | Exceptional 30.1% |
| Immigrants | South Central Asia | 100.0 /100 | #15 | Exceptional 30.0% |
| Immigrants | Afghanistan | 100.0 /100 | #16 | Exceptional 30.0% |
| Hispanics or Latinos | 100.0 /100 | #17 | Exceptional 29.9% |
| Salvadorans | 100.0 /100 | #18 | Exceptional 29.9% |
| Alaska Natives | 100.0 /100 | #19 | Exceptional 29.9% |
| Immigrants | El Salvador | 100.0 /100 | #20 | Exceptional 29.8% |
| Immigrants | Laos | 100.0 /100 | #21 | Exceptional 29.8% |