Slovene vs Bangladeshi Receiving Food Stamps
COMPARE
Slovene
Bangladeshi
Receiving Food Stamps
Receiving Food Stamps Comparison
Slovenes
Bangladeshis
9.8%
RECEIVING FOOD STAMPS
99.1/ 100
METRIC RATING
66th/ 347
METRIC RANK
15.0%
RECEIVING FOOD STAMPS
0.0/ 100
METRIC RATING
283rd/ 347
METRIC RANK
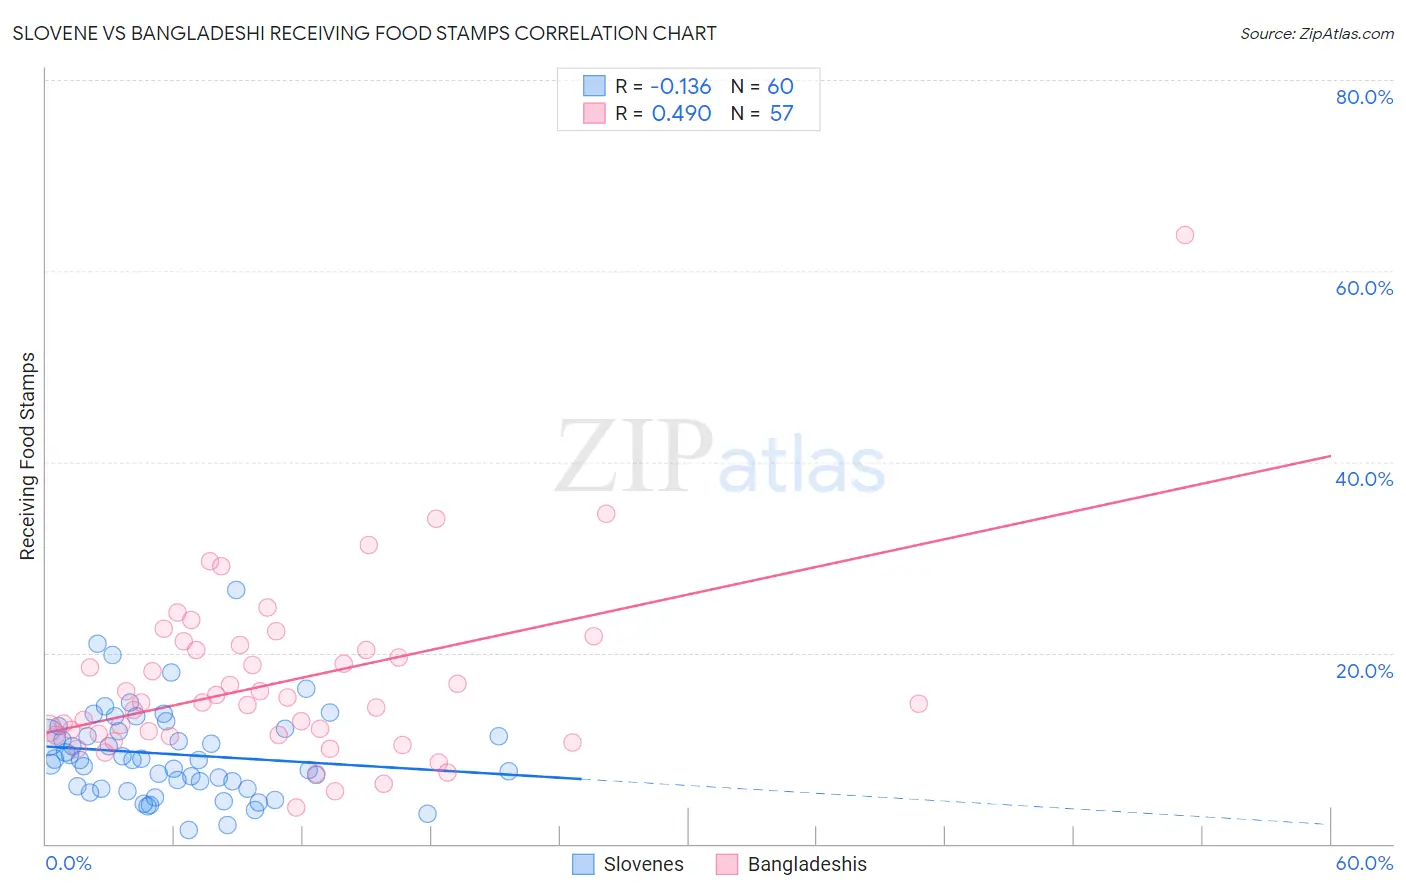
Slovene vs Bangladeshi Receiving Food Stamps Correlation Chart
The statistical analysis conducted on geographies consisting of 260,914,869 people shows a poor negative correlation between the proportion of Slovenes and percentage of population receiving government assistance and/or food stamps in the United States with a correlation coefficient (R) of -0.136 and weighted average of 9.8%. Similarly, the statistical analysis conducted on geographies consisting of 141,258,280 people shows a moderate positive correlation between the proportion of Bangladeshis and percentage of population receiving government assistance and/or food stamps in the United States with a correlation coefficient (R) of 0.490 and weighted average of 15.0%, a difference of 53.3%.
Receiving Food Stamps Correlation Summary
| Measurement | Slovene | Bangladeshi |
| Minimum | 1.5% | 3.8% |
| Maximum | 26.6% | 63.8% |
| Range | 25.1% | 60.0% |
| Mean | 9.4% | 16.9% |
| Median | 8.8% | 14.7% |
| Interquartile 25% (IQ1) | 5.9% | 11.4% |
| Interquartile 75% (IQ3) | 11.9% | 20.6% |
| Interquartile Range (IQR) | 6.1% | 9.2% |
| Standard Deviation (Sample) | 4.8% | 9.4% |
| Standard Deviation (Population) | 4.7% | 9.3% |
Similar Demographics by Receiving Food Stamps
Demographics Similar to Slovenes by Receiving Food Stamps
In terms of receiving food stamps, the demographic groups most similar to Slovenes are Immigrants from Indonesia (9.8%, a difference of 0.16%), Immigrants from Turkey (9.8%, a difference of 0.20%), Northern European (9.8%, a difference of 0.22%), Immigrants from North America (9.8%, a difference of 0.37%), and Italian (9.9%, a difference of 0.43%).
| Demographics | Rating | Rank | Receiving Food Stamps |
| British | 99.2 /100 | #59 | Exceptional 9.7% |
| Germans | 99.2 /100 | #60 | Exceptional 9.7% |
| English | 99.2 /100 | #61 | Exceptional 9.8% |
| Immigrants | Bulgaria | 99.2 /100 | #62 | Exceptional 9.8% |
| Chinese | 99.2 /100 | #63 | Exceptional 9.8% |
| Immigrants | North America | 99.2 /100 | #64 | Exceptional 9.8% |
| Immigrants | Turkey | 99.1 /100 | #65 | Exceptional 9.8% |
| Slovenes | 99.1 /100 | #66 | Exceptional 9.8% |
| Immigrants | Indonesia | 99.0 /100 | #67 | Exceptional 9.8% |
| Northern Europeans | 99.0 /100 | #68 | Exceptional 9.8% |
| Italians | 99.0 /100 | #69 | Exceptional 9.9% |
| Immigrants | Serbia | 99.0 /100 | #70 | Exceptional 9.9% |
| Scottish | 98.9 /100 | #71 | Exceptional 9.9% |
| Immigrants | Asia | 98.9 /100 | #72 | Exceptional 9.9% |
| Macedonians | 98.9 /100 | #73 | Exceptional 9.9% |
Demographics Similar to Bangladeshis by Receiving Food Stamps
In terms of receiving food stamps, the demographic groups most similar to Bangladeshis are Immigrants from Ecuador (15.0%, a difference of 0.010%), Immigrants from Central America (15.0%, a difference of 0.28%), Immigrants from Liberia (15.1%, a difference of 0.39%), African (15.1%, a difference of 0.53%), and Immigrants from Mexico (15.2%, a difference of 0.76%).
| Demographics | Rating | Rank | Receiving Food Stamps |
| Liberians | 0.1 /100 | #276 | Tragic 14.8% |
| Seminole | 0.1 /100 | #277 | Tragic 14.8% |
| Belizeans | 0.1 /100 | #278 | Tragic 14.8% |
| Kiowa | 0.0 /100 | #279 | Tragic 14.9% |
| Ecuadorians | 0.0 /100 | #280 | Tragic 14.9% |
| Spanish American Indians | 0.0 /100 | #281 | Tragic 14.9% |
| Immigrants | Central America | 0.0 /100 | #282 | Tragic 15.0% |
| Bangladeshis | 0.0 /100 | #283 | Tragic 15.0% |
| Immigrants | Ecuador | 0.0 /100 | #284 | Tragic 15.0% |
| Immigrants | Liberia | 0.0 /100 | #285 | Tragic 15.1% |
| Africans | 0.0 /100 | #286 | Tragic 15.1% |
| Immigrants | Mexico | 0.0 /100 | #287 | Tragic 15.2% |
| Immigrants | Belize | 0.0 /100 | #288 | Tragic 15.2% |
| Immigrants | Senegal | 0.0 /100 | #289 | Tragic 15.3% |
| Senegalese | 0.0 /100 | #290 | Tragic 15.4% |