Sioux vs Immigrants from Guatemala Single Mother Households
COMPARE
Sioux
Immigrants from Guatemala
Single Mother Households
Single Mother Households Comparison
Sioux
Immigrants from Guatemala
8.5%
SINGLE MOTHER HOUSEHOLDS
0.0/ 100
METRIC RATING
331st/ 347
METRIC RANK
7.7%
SINGLE MOTHER HOUSEHOLDS
0.0/ 100
METRIC RATING
287th/ 347
METRIC RANK
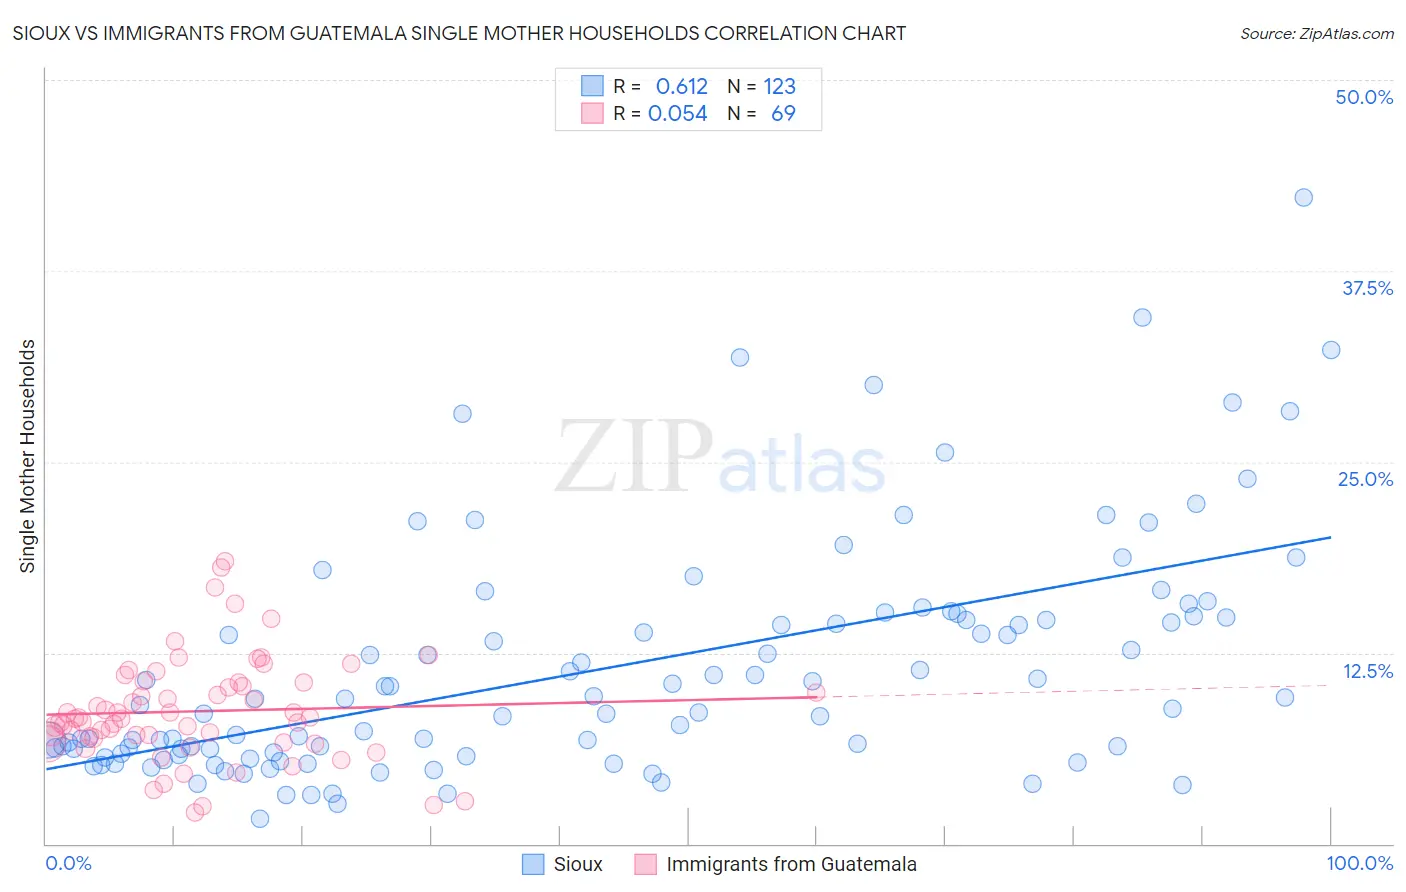
Sioux vs Immigrants from Guatemala Single Mother Households Correlation Chart
The statistical analysis conducted on geographies consisting of 233,811,007 people shows a significant positive correlation between the proportion of Sioux and percentage of single mother households in the United States with a correlation coefficient (R) of 0.612 and weighted average of 8.5%. Similarly, the statistical analysis conducted on geographies consisting of 376,787,729 people shows a slight positive correlation between the proportion of Immigrants from Guatemala and percentage of single mother households in the United States with a correlation coefficient (R) of 0.054 and weighted average of 7.7%, a difference of 9.7%.
Single Mother Households Correlation Summary
| Measurement | Sioux | Immigrants from Guatemala |
| Minimum | 1.6% | 2.0% |
| Maximum | 42.3% | 18.5% |
| Range | 40.7% | 16.5% |
| Mean | 11.4% | 8.7% |
| Median | 9.1% | 8.2% |
| Interquartile 25% (IQ1) | 5.9% | 6.8% |
| Interquartile 75% (IQ3) | 14.8% | 10.5% |
| Interquartile Range (IQR) | 8.9% | 3.7% |
| Standard Deviation (Sample) | 7.6% | 3.4% |
| Standard Deviation (Population) | 7.6% | 3.4% |
Similar Demographics by Single Mother Households
Demographics Similar to Sioux by Single Mother Households
In terms of single mother households, the demographic groups most similar to Sioux are Inupiat (8.5%, a difference of 0.0%), Hopi (8.5%, a difference of 0.11%), Yakama (8.4%, a difference of 0.86%), Immigrants from Haiti (8.4%, a difference of 1.0%), and British West Indian (8.4%, a difference of 1.2%).
| Demographics | Rating | Rank | Single Mother Households |
| Immigrants | Jamaica | 0.0 /100 | #324 | Tragic 8.4% |
| Immigrants | Caribbean | 0.0 /100 | #325 | Tragic 8.4% |
| British West Indians | 0.0 /100 | #326 | Tragic 8.4% |
| Immigrants | Haiti | 0.0 /100 | #327 | Tragic 8.4% |
| Yakama | 0.0 /100 | #328 | Tragic 8.4% |
| Hopi | 0.0 /100 | #329 | Tragic 8.5% |
| Inupiat | 0.0 /100 | #330 | Tragic 8.5% |
| Sioux | 0.0 /100 | #331 | Tragic 8.5% |
| U.S. Virgin Islanders | 0.0 /100 | #332 | Tragic 8.6% |
| Liberians | 0.0 /100 | #333 | Tragic 8.6% |
| Immigrants | Liberia | 0.0 /100 | #334 | Tragic 8.7% |
| Immigrants | Dominica | 0.0 /100 | #335 | Tragic 8.7% |
| Puerto Ricans | 0.0 /100 | #336 | Tragic 8.7% |
| Navajo | 0.0 /100 | #337 | Tragic 8.8% |
| Cape Verdeans | 0.0 /100 | #338 | Tragic 8.9% |
Demographics Similar to Immigrants from Guatemala by Single Mother Households
In terms of single mother households, the demographic groups most similar to Immigrants from Guatemala are Sierra Leonean (7.7%, a difference of 0.050%), Immigrants from Middle Africa (7.7%, a difference of 0.10%), Trinidadian and Tobagonian (7.7%, a difference of 0.21%), Immigrants from Belize (7.7%, a difference of 0.24%), and Nigerian (7.7%, a difference of 0.84%).
| Demographics | Rating | Rank | Single Mother Households |
| Immigrants | Sierra Leone | 0.0 /100 | #280 | Tragic 7.7% |
| Immigrants | Laos | 0.0 /100 | #281 | Tragic 7.7% |
| Guatemalans | 0.0 /100 | #282 | Tragic 7.7% |
| Nigerians | 0.0 /100 | #283 | Tragic 7.7% |
| Immigrants | Belize | 0.0 /100 | #284 | Tragic 7.7% |
| Trinidadians and Tobagonians | 0.0 /100 | #285 | Tragic 7.7% |
| Immigrants | Middle Africa | 0.0 /100 | #286 | Tragic 7.7% |
| Immigrants | Guatemala | 0.0 /100 | #287 | Tragic 7.7% |
| Sierra Leoneans | 0.0 /100 | #288 | Tragic 7.7% |
| Sub-Saharan Africans | 0.0 /100 | #289 | Tragic 7.8% |
| Immigrants | Nigeria | 0.0 /100 | #290 | Tragic 7.8% |
| West Indians | 0.0 /100 | #291 | Tragic 7.8% |
| Ghanaians | 0.0 /100 | #292 | Tragic 7.8% |
| Immigrants | Cameroon | 0.0 /100 | #293 | Tragic 7.9% |
| Apache | 0.0 /100 | #294 | Tragic 7.9% |