Sioux vs Immigrants from Spain Single Mother Households
COMPARE
Sioux
Immigrants from Spain
Single Mother Households
Single Mother Households Comparison
Sioux
Immigrants from Spain
8.5%
SINGLE MOTHER HOUSEHOLDS
0.0/ 100
METRIC RATING
331st/ 347
METRIC RANK
5.9%
SINGLE MOTHER HOUSEHOLDS
91.2/ 100
METRIC RATING
131st/ 347
METRIC RANK
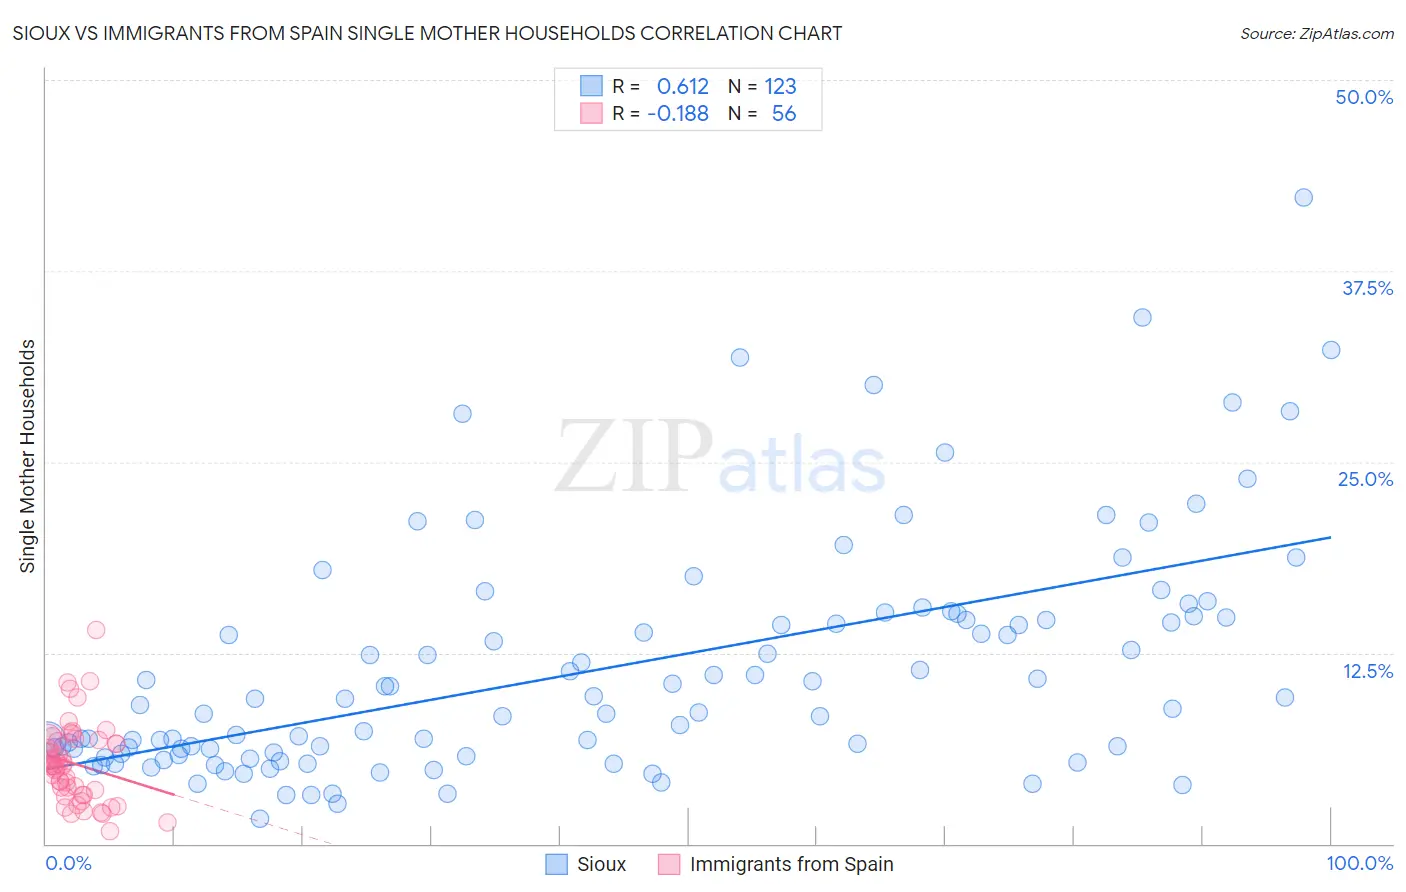
Sioux vs Immigrants from Spain Single Mother Households Correlation Chart
The statistical analysis conducted on geographies consisting of 233,811,007 people shows a significant positive correlation between the proportion of Sioux and percentage of single mother households in the United States with a correlation coefficient (R) of 0.612 and weighted average of 8.5%. Similarly, the statistical analysis conducted on geographies consisting of 239,327,015 people shows a poor negative correlation between the proportion of Immigrants from Spain and percentage of single mother households in the United States with a correlation coefficient (R) of -0.188 and weighted average of 5.9%, a difference of 43.6%.
Single Mother Households Correlation Summary
| Measurement | Sioux | Immigrants from Spain |
| Minimum | 1.6% | 0.79% |
| Maximum | 42.3% | 14.0% |
| Range | 40.7% | 13.2% |
| Mean | 11.4% | 5.2% |
| Median | 9.1% | 5.1% |
| Interquartile 25% (IQ1) | 5.9% | 3.3% |
| Interquartile 75% (IQ3) | 14.8% | 6.8% |
| Interquartile Range (IQR) | 8.9% | 3.5% |
| Standard Deviation (Sample) | 7.6% | 2.6% |
| Standard Deviation (Population) | 7.6% | 2.5% |
Similar Demographics by Single Mother Households
Demographics Similar to Sioux by Single Mother Households
In terms of single mother households, the demographic groups most similar to Sioux are Inupiat (8.5%, a difference of 0.0%), Hopi (8.5%, a difference of 0.11%), Yakama (8.4%, a difference of 0.86%), Immigrants from Haiti (8.4%, a difference of 1.0%), and British West Indian (8.4%, a difference of 1.2%).
| Demographics | Rating | Rank | Single Mother Households |
| Immigrants | Jamaica | 0.0 /100 | #324 | Tragic 8.4% |
| Immigrants | Caribbean | 0.0 /100 | #325 | Tragic 8.4% |
| British West Indians | 0.0 /100 | #326 | Tragic 8.4% |
| Immigrants | Haiti | 0.0 /100 | #327 | Tragic 8.4% |
| Yakama | 0.0 /100 | #328 | Tragic 8.4% |
| Hopi | 0.0 /100 | #329 | Tragic 8.5% |
| Inupiat | 0.0 /100 | #330 | Tragic 8.5% |
| Sioux | 0.0 /100 | #331 | Tragic 8.5% |
| U.S. Virgin Islanders | 0.0 /100 | #332 | Tragic 8.6% |
| Liberians | 0.0 /100 | #333 | Tragic 8.6% |
| Immigrants | Liberia | 0.0 /100 | #334 | Tragic 8.7% |
| Immigrants | Dominica | 0.0 /100 | #335 | Tragic 8.7% |
| Puerto Ricans | 0.0 /100 | #336 | Tragic 8.7% |
| Navajo | 0.0 /100 | #337 | Tragic 8.8% |
| Cape Verdeans | 0.0 /100 | #338 | Tragic 8.9% |
Demographics Similar to Immigrants from Spain by Single Mother Households
In terms of single mother households, the demographic groups most similar to Immigrants from Spain are Albanian (5.9%, a difference of 0.040%), Egyptian (5.9%, a difference of 0.20%), Canadian (5.9%, a difference of 0.26%), Palestinian (5.9%, a difference of 0.35%), and Immigrants from Saudi Arabia (5.9%, a difference of 0.35%).
| Demographics | Rating | Rank | Single Mother Households |
| Immigrants | Argentina | 93.2 /100 | #124 | Exceptional 5.9% |
| Slavs | 92.9 /100 | #125 | Exceptional 5.9% |
| Welsh | 92.8 /100 | #126 | Exceptional 5.9% |
| Lebanese | 92.4 /100 | #127 | Exceptional 5.9% |
| Czechoslovakians | 92.2 /100 | #128 | Exceptional 5.9% |
| Immigrants | Bolivia | 92.2 /100 | #129 | Exceptional 5.9% |
| Palestinians | 92.1 /100 | #130 | Exceptional 5.9% |
| Immigrants | Spain | 91.2 /100 | #131 | Exceptional 5.9% |
| Albanians | 91.1 /100 | #132 | Exceptional 5.9% |
| Egyptians | 90.7 /100 | #133 | Exceptional 5.9% |
| Canadians | 90.5 /100 | #134 | Exceptional 5.9% |
| Immigrants | Saudi Arabia | 90.2 /100 | #135 | Exceptional 5.9% |
| Jordanians | 88.9 /100 | #136 | Excellent 6.0% |
| Immigrants | Pakistan | 88.4 /100 | #137 | Excellent 6.0% |
| Icelanders | 86.9 /100 | #138 | Excellent 6.0% |