Salvadoran vs Immigrants from Germany Married-couple Households
COMPARE
Salvadoran
Immigrants from Germany
Married-couple Households
Married-couple Households Comparison
Salvadorans
Immigrants from Germany
44.7%
MARRIED-COUPLE HOUSEHOLDS
1.9/ 100
METRIC RATING
227th/ 347
METRIC RANK
47.5%
MARRIED-COUPLE HOUSEHOLDS
92.4/ 100
METRIC RATING
118th/ 347
METRIC RANK
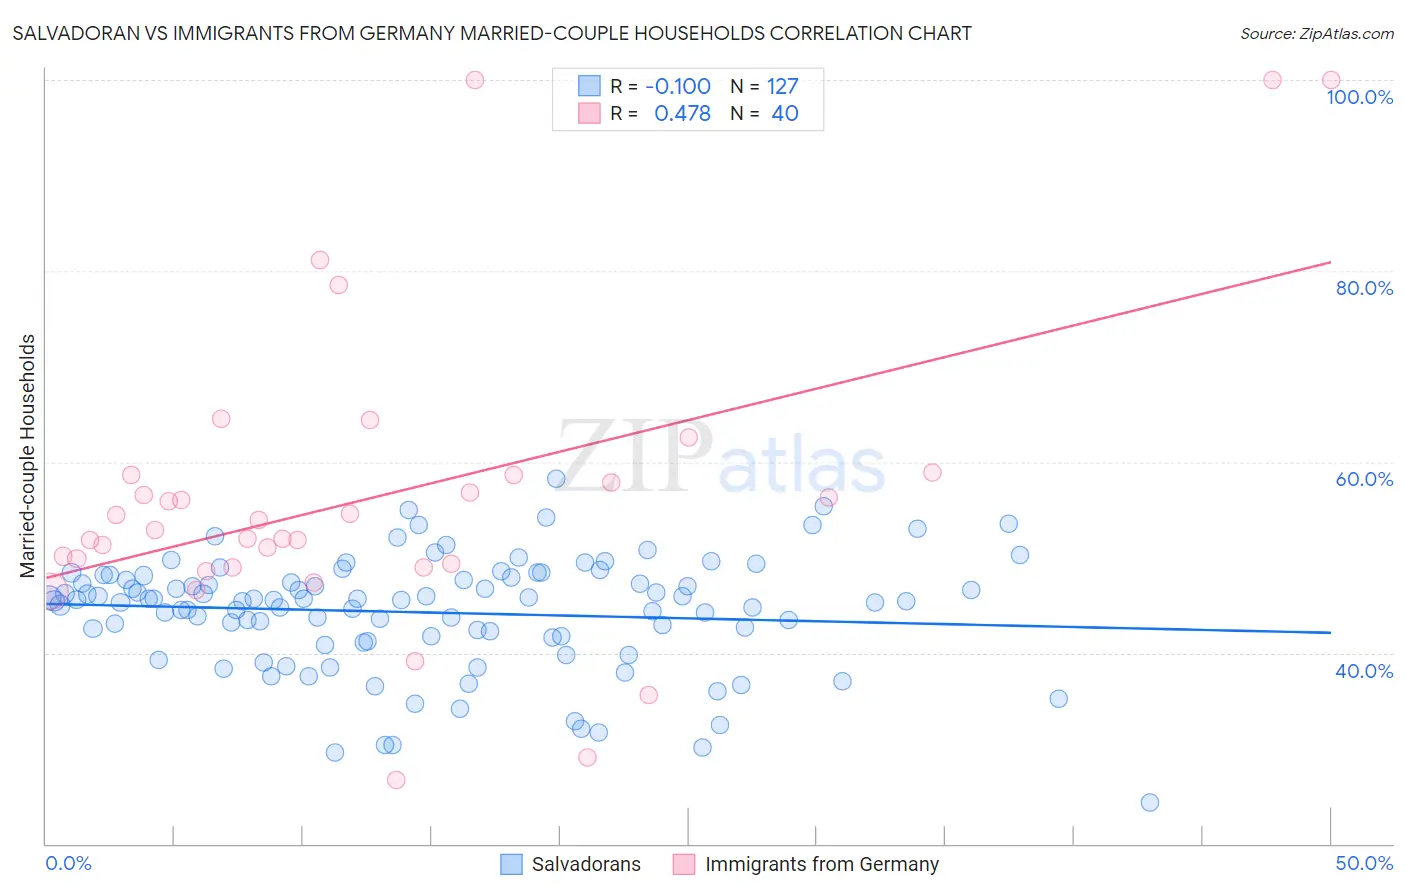
Salvadoran vs Immigrants from Germany Married-couple Households Correlation Chart
The statistical analysis conducted on geographies consisting of 398,667,012 people shows a poor negative correlation between the proportion of Salvadorans and percentage of married-couple family households in the United States with a correlation coefficient (R) of -0.100 and weighted average of 44.7%. Similarly, the statistical analysis conducted on geographies consisting of 463,743,898 people shows a moderate positive correlation between the proportion of Immigrants from Germany and percentage of married-couple family households in the United States with a correlation coefficient (R) of 0.478 and weighted average of 47.5%, a difference of 6.3%.
Married-couple Households Correlation Summary
| Measurement | Salvadoran | Immigrants from Germany |
| Minimum | 24.4% | 26.7% |
| Maximum | 58.2% | 100.0% |
| Range | 33.9% | 73.3% |
| Mean | 44.2% | 56.5% |
| Median | 45.5% | 53.4% |
| Interquartile 25% (IQ1) | 41.6% | 49.1% |
| Interquartile 75% (IQ3) | 47.9% | 58.6% |
| Interquartile Range (IQR) | 6.3% | 9.5% |
| Standard Deviation (Sample) | 6.0% | 16.1% |
| Standard Deviation (Population) | 5.9% | 15.9% |
Similar Demographics by Married-couple Households
Demographics Similar to Salvadorans by Married-couple Households
In terms of married-couple households, the demographic groups most similar to Salvadorans are Kenyan (44.7%, a difference of 0.13%), Immigrants from Latin America (44.7%, a difference of 0.18%), Alsatian (44.8%, a difference of 0.19%), Soviet Union (44.6%, a difference of 0.22%), and Houma (44.6%, a difference of 0.22%).
| Demographics | Rating | Rank | Married-couple Households |
| Immigrants | Thailand | 5.1 /100 | #220 | Tragic 45.2% |
| Tlingit-Haida | 4.9 /100 | #221 | Tragic 45.1% |
| Immigrants | Laos | 4.6 /100 | #222 | Tragic 45.1% |
| Immigrants | Cambodia | 2.7 /100 | #223 | Tragic 44.9% |
| Immigrants | Micronesia | 2.6 /100 | #224 | Tragic 44.9% |
| Dutch West Indians | 2.6 /100 | #225 | Tragic 44.9% |
| Alsatians | 2.3 /100 | #226 | Tragic 44.8% |
| Salvadorans | 1.9 /100 | #227 | Tragic 44.7% |
| Kenyans | 1.7 /100 | #228 | Tragic 44.7% |
| Immigrants | Latin America | 1.6 /100 | #229 | Tragic 44.7% |
| Soviet Union | 1.6 /100 | #230 | Tragic 44.6% |
| Houma | 1.5 /100 | #231 | Tragic 44.6% |
| Marshallese | 1.5 /100 | #232 | Tragic 44.6% |
| Immigrants | Uganda | 1.5 /100 | #233 | Tragic 44.6% |
| Immigrants | Panama | 1.3 /100 | #234 | Tragic 44.6% |
Demographics Similar to Immigrants from Germany by Married-couple Households
In terms of married-couple households, the demographic groups most similar to Immigrants from Germany are French Canadian (47.5%, a difference of 0.010%), Argentinean (47.5%, a difference of 0.020%), Chilean (47.5%, a difference of 0.030%), Slovak (47.6%, a difference of 0.070%), and Immigrants from Europe (47.6%, a difference of 0.19%).
| Demographics | Rating | Rank | Married-couple Households |
| Syrians | 93.9 /100 | #111 | Exceptional 47.6% |
| Peruvians | 93.8 /100 | #112 | Exceptional 47.6% |
| Venezuelans | 93.8 /100 | #113 | Exceptional 47.6% |
| Immigrants | Europe | 93.7 /100 | #114 | Exceptional 47.6% |
| Slovaks | 92.9 /100 | #115 | Exceptional 47.6% |
| Argentineans | 92.5 /100 | #116 | Exceptional 47.5% |
| French Canadians | 92.4 /100 | #117 | Exceptional 47.5% |
| Immigrants | Germany | 92.4 /100 | #118 | Exceptional 47.5% |
| Chileans | 92.2 /100 | #119 | Exceptional 47.5% |
| Puget Sound Salish | 90.5 /100 | #120 | Exceptional 47.4% |
| Immigrants | Eastern Europe | 90.3 /100 | #121 | Exceptional 47.4% |
| Okinawans | 90.1 /100 | #122 | Exceptional 47.4% |
| Immigrants | Venezuela | 89.3 /100 | #123 | Excellent 47.4% |
| Zimbabweans | 89.2 /100 | #124 | Excellent 47.4% |
| Australians | 89.0 /100 | #125 | Excellent 47.4% |