Cypriot vs Immigrants from Germany Married-couple Households
COMPARE
Cypriot
Immigrants from Germany
Married-couple Households
Married-couple Households Comparison
Cypriots
Immigrants from Germany
48.0%
MARRIED-COUPLE HOUSEHOLDS
97.2/ 100
METRIC RATING
89th/ 347
METRIC RANK
47.5%
MARRIED-COUPLE HOUSEHOLDS
92.4/ 100
METRIC RATING
118th/ 347
METRIC RANK
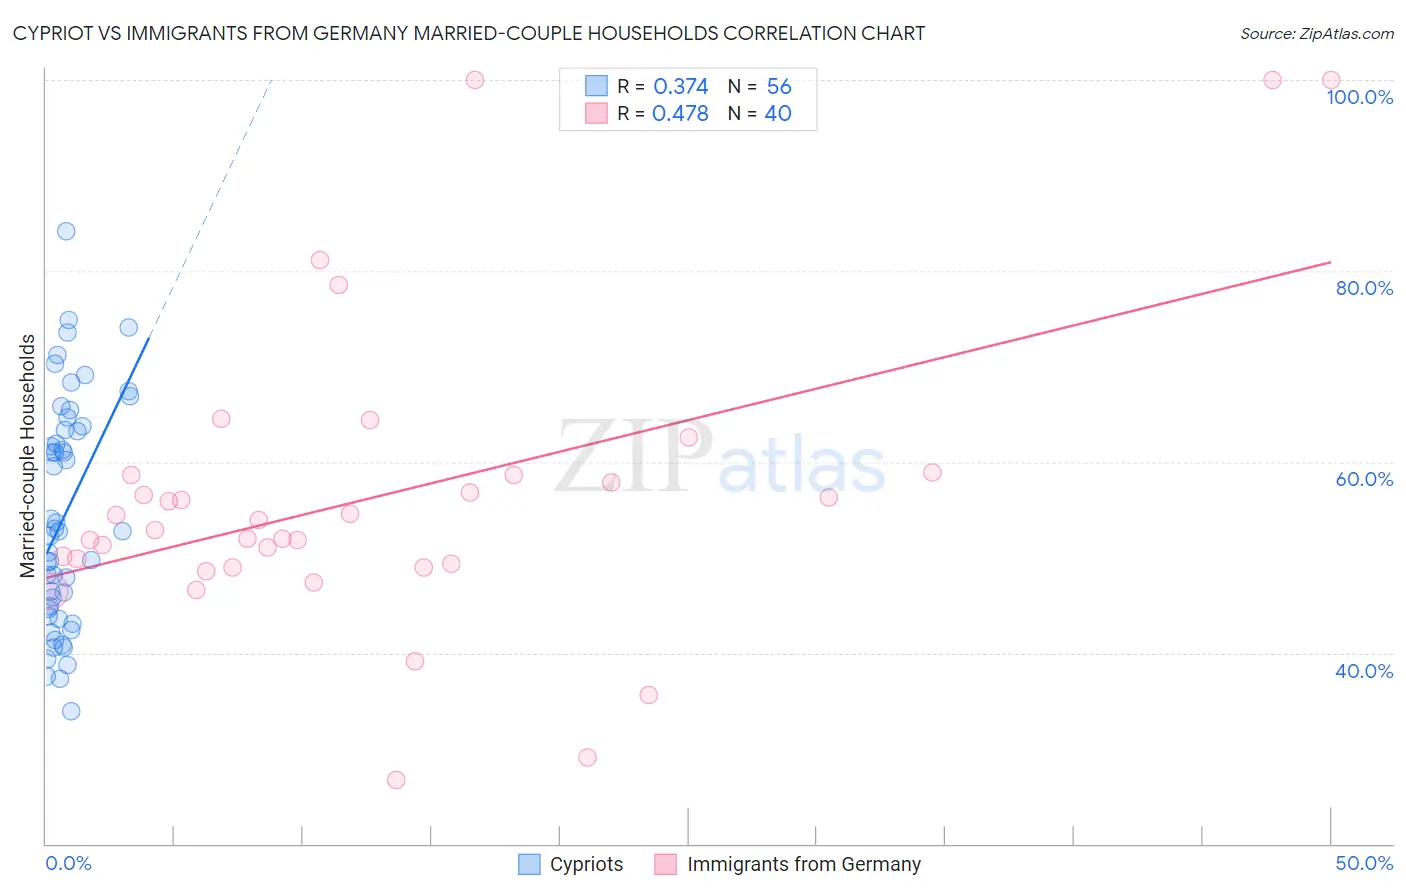
Cypriot vs Immigrants from Germany Married-couple Households Correlation Chart
The statistical analysis conducted on geographies consisting of 61,857,015 people shows a mild positive correlation between the proportion of Cypriots and percentage of married-couple family households in the United States with a correlation coefficient (R) of 0.374 and weighted average of 48.0%. Similarly, the statistical analysis conducted on geographies consisting of 463,743,898 people shows a moderate positive correlation between the proportion of Immigrants from Germany and percentage of married-couple family households in the United States with a correlation coefficient (R) of 0.478 and weighted average of 47.5%, a difference of 0.98%.
Married-couple Households Correlation Summary
| Measurement | Cypriot | Immigrants from Germany |
| Minimum | 33.8% | 26.7% |
| Maximum | 84.2% | 100.0% |
| Range | 50.4% | 73.3% |
| Mean | 54.4% | 56.5% |
| Median | 52.8% | 53.4% |
| Interquartile 25% (IQ1) | 44.2% | 49.1% |
| Interquartile 75% (IQ3) | 63.6% | 58.6% |
| Interquartile Range (IQR) | 19.3% | 9.5% |
| Standard Deviation (Sample) | 11.9% | 16.1% |
| Standard Deviation (Population) | 11.8% | 15.9% |
Similar Demographics by Married-couple Households
Demographics Similar to Cypriots by Married-couple Households
In terms of married-couple households, the demographic groups most similar to Cypriots are French (48.0%, a difference of 0.010%), Immigrants from Ireland (48.0%, a difference of 0.030%), Afghan (48.0%, a difference of 0.030%), Belgian (48.0%, a difference of 0.050%), and Immigrants from Israel (48.0%, a difference of 0.070%).
| Demographics | Rating | Rank | Married-couple Households |
| Immigrants | Poland | 97.7 /100 | #82 | Exceptional 48.1% |
| Guamanians/Chamorros | 97.6 /100 | #83 | Exceptional 48.1% |
| Ukrainians | 97.6 /100 | #84 | Exceptional 48.1% |
| Immigrants | Israel | 97.4 /100 | #85 | Exceptional 48.0% |
| Belgians | 97.4 /100 | #86 | Exceptional 48.0% |
| Immigrants | Ireland | 97.3 /100 | #87 | Exceptional 48.0% |
| Afghans | 97.3 /100 | #88 | Exceptional 48.0% |
| Cypriots | 97.2 /100 | #89 | Exceptional 48.0% |
| French | 97.2 /100 | #90 | Exceptional 48.0% |
| Immigrants | Moldova | 97.0 /100 | #91 | Exceptional 48.0% |
| Palestinians | 96.9 /100 | #92 | Exceptional 48.0% |
| Lebanese | 96.9 /100 | #93 | Exceptional 47.9% |
| Americans | 96.9 /100 | #94 | Exceptional 47.9% |
| Immigrants | Belgium | 96.8 /100 | #95 | Exceptional 47.9% |
| Immigrants | Egypt | 96.6 /100 | #96 | Exceptional 47.9% |
Demographics Similar to Immigrants from Germany by Married-couple Households
In terms of married-couple households, the demographic groups most similar to Immigrants from Germany are French Canadian (47.5%, a difference of 0.010%), Argentinean (47.5%, a difference of 0.020%), Chilean (47.5%, a difference of 0.030%), Slovak (47.6%, a difference of 0.070%), and Immigrants from Europe (47.6%, a difference of 0.19%).
| Demographics | Rating | Rank | Married-couple Households |
| Syrians | 93.9 /100 | #111 | Exceptional 47.6% |
| Peruvians | 93.8 /100 | #112 | Exceptional 47.6% |
| Venezuelans | 93.8 /100 | #113 | Exceptional 47.6% |
| Immigrants | Europe | 93.7 /100 | #114 | Exceptional 47.6% |
| Slovaks | 92.9 /100 | #115 | Exceptional 47.6% |
| Argentineans | 92.5 /100 | #116 | Exceptional 47.5% |
| French Canadians | 92.4 /100 | #117 | Exceptional 47.5% |
| Immigrants | Germany | 92.4 /100 | #118 | Exceptional 47.5% |
| Chileans | 92.2 /100 | #119 | Exceptional 47.5% |
| Puget Sound Salish | 90.5 /100 | #120 | Exceptional 47.4% |
| Immigrants | Eastern Europe | 90.3 /100 | #121 | Exceptional 47.4% |
| Okinawans | 90.1 /100 | #122 | Exceptional 47.4% |
| Immigrants | Venezuela | 89.3 /100 | #123 | Excellent 47.4% |
| Zimbabweans | 89.2 /100 | #124 | Excellent 47.4% |
| Australians | 89.0 /100 | #125 | Excellent 47.4% |