Russian vs Panamanian Family Households

COMPARE

Russian
Race
Ancestry
AfghanAfricanAlaska NativeAlaskan AthabascanAlbanianAleutAlsatianAmericanApacheArabArapahoArgentineanArmenianAssyrian/Chaldean/SyriacAustralianAustrianBahamianBangladeshiBarbadianBasqueBelgianBelizeanBermudanBhutaneseBlackfeetBolivianBrazilianBritishBritish West IndianBulgarianBurmeseCajunCambodianCanadianCape VerdeanCarpatho RusynCelticCentral AmericanCentral American IndianCherokeeCheyenneChickasawChileanChineseChippewaChoctawColombianColvilleComancheCosta RicanCreeCreekCroatianCrowCubanCypriotCzechCzechoslovakianDanishDelawareDominicanDutchDutch West IndianEastern EuropeanEcuadorianEgyptianEnglishEstonianEthiopianEuropeanFijianFilipinoFinnishFrenchFrench American IndianFrench CanadianGermanGerman RussianGhanaianGreekGuamanian/ChamorroGuatemalanGuyaneseHaitianHmongHonduranHopiHoumaHungarianIcelanderIndian (Asian)IndonesianInupiatIranianIraqiIrishIroquoisIsraeliItalianJamaicanJapaneseJordanianKenyanKiowaKoreanLaotianLatvianLebaneseLiberianLithuanianLumbeeLuxembourgerMacedonianMalaysianMalteseMarshalleseMenomineeMexicanMexican American IndianMongolianMoroccanNative HawaiianNavajoNepaleseNew ZealanderNicaraguanNigerianNorthern EuropeanNorwegianOkinawanOsageOttawaPaiutePakistaniPalestinianParaguayanPennsylvania GermanPeruvianPimaPolishPortuguesePotawatomiPuebloPuerto RicanPuget Sound SalishRomanianRussianSalvadoranSamoanScandinavianScotch-IrishScottishSeminoleSenegaleseSerbianShoshoneSierra LeoneanSiouxSlavicSlovakSloveneSomaliSouth AfricanSouth AmericanSouth American IndianSoviet UnionSpaniardSpanishSpanish AmericanSpanish American IndianSri LankanSubsaharan AfricanSudaneseSwedishSwissSyrianTaiwaneseThaiTlingit-HaidaTohono O'OdhamTonganTrinidadian and TobagonianTsimshianTurkishU.S. Virgin IslanderUgandanUkrainianUruguayanUteVenezuelanVietnameseWelshWest IndianYakamaYaquiYugoslavianYumanYup'ikZimbabwean
Immigration
NonimmigrantsImmigrantsAfghanistanAfricaAlbaniaArgentinaArmeniaAsiaAustraliaAustriaBahamasBangladeshBarbadosBelarusBelgiumBelizeBoliviaBosnia and HerzegovinaBrazilBulgariaBurma/MyanmarCabo VerdeCambodiaCameroonCanadaCaribbeanCentral AmericaChileChinaColombiaCongoCosta RicaCroatiaCubaCzechoslovakiaDenmarkDominicaDominican RepublicEastern AfricaEastern AsiaEastern EuropeEcuadorEgyptEl SalvadorEnglandEritreaEthiopiaEuropeFijiFranceGermanyGhanaGreeceGrenadaGuatemalaGuyanaHaitiHondurasHong KongHungaryIndiaIndonesiaIranIraqIrelandIsraelItalyJamaicaJapanJordanKazakhstanKenyaKoreaKuwaitLaosLatin AmericaLatviaLebanonLiberiaLithuaniaMalaysiaMexicoMicronesiaMiddle AfricaMoldovaMoroccoNepalNetherlandsNicaraguaNigeriaNorth AmericaNorth MacedoniaNorthern AfricaNorthern EuropeNorwayOceaniaPakistanPanamaPeruPhilippinesPolandPortugalRomaniaRussiaSaudi ArabiaScotlandSenegalSerbiaSierra LeoneSingaporeSomaliaSouth AfricaSouth AmericaSouth Central AsiaSouth Eastern AsiaSouthern EuropeSpainSri LankaSt. Vincent and the GrenadinesSudanSwedenSwitzerlandSyriaTaiwanThailandTrinidad and TobagoTurkeyUgandaUkraineUruguayUzbekistanVenezuelaVietnamWest IndiesWestern AfricaWestern AsiaWestern EuropeYemenZaireZimbabweAzores
Panamanian
Race
Ancestry
AfghanAfricanAlaska NativeAlaskan AthabascanAlbanianAleutAlsatianAmericanApacheArabArapahoArgentineanArmenianAssyrian/Chaldean/SyriacAustralianAustrianBahamianBangladeshiBarbadianBasqueBelgianBelizeanBermudanBhutaneseBlackfeetBolivianBrazilianBritishBritish West IndianBulgarianBurmeseCajunCambodianCanadianCape VerdeanCarpatho RusynCelticCentral AmericanCentral American IndianCherokeeCheyenneChickasawChileanChineseChippewaChoctawColombianColvilleComancheCosta RicanCreeCreekCroatianCrowCubanCypriotCzechCzechoslovakianDanishDelawareDominicanDutchDutch West IndianEastern EuropeanEcuadorianEgyptianEnglishEstonianEthiopianEuropeanFijianFilipinoFinnishFrenchFrench American IndianFrench CanadianGermanGerman RussianGhanaianGreekGuamanian/ChamorroGuatemalanGuyaneseHaitianHmongHonduranHopiHoumaHungarianIcelanderIndian (Asian)IndonesianInupiatIranianIraqiIrishIroquoisIsraeliItalianJamaicanJapaneseJordanianKenyanKiowaKoreanLaotianLatvianLebaneseLiberianLithuanianLumbeeLuxembourgerMacedonianMalaysianMalteseMarshalleseMenomineeMexicanMexican American IndianMongolianMoroccanNative HawaiianNavajoNepaleseNew ZealanderNicaraguanNigerianNorthern EuropeanNorwegianOkinawanOsageOttawaPaiutePakistaniPalestinianPanamanianParaguayanPennsylvania GermanPeruvianPimaPolishPortuguesePotawatomiPuebloPuerto RicanPuget Sound SalishRomanianSalvadoranSamoanScandinavianScotch-IrishScottishSeminoleSenegaleseSerbianShoshoneSierra LeoneanSiouxSlavicSlovakSloveneSomaliSouth AfricanSouth AmericanSouth American IndianSoviet UnionSpaniardSpanishSpanish AmericanSpanish American IndianSri LankanSubsaharan AfricanSudaneseSwedishSwissSyrianTaiwaneseThaiTlingit-HaidaTohono O'OdhamTonganTrinidadian and TobagonianTsimshianTurkishU.S. Virgin IslanderUgandanUkrainianUruguayanUteVenezuelanVietnameseWelshWest IndianYakamaYaquiYugoslavianYumanYup'ikZimbabwean
Immigration
NonimmigrantsImmigrantsAfghanistanAfricaAlbaniaArgentinaArmeniaAsiaAustraliaAustriaBahamasBangladeshBarbadosBelarusBelgiumBelizeBoliviaBosnia and HerzegovinaBrazilBulgariaBurma/MyanmarCabo VerdeCambodiaCameroonCanadaCaribbeanCentral AmericaChileChinaColombiaCongoCosta RicaCroatiaCubaCzechoslovakiaDenmarkDominicaDominican RepublicEastern AfricaEastern AsiaEastern EuropeEcuadorEgyptEl SalvadorEnglandEritreaEthiopiaEuropeFijiFranceGermanyGhanaGreeceGrenadaGuatemalaGuyanaHaitiHondurasHong KongHungaryIndiaIndonesiaIranIraqIrelandIsraelItalyJamaicaJapanJordanKazakhstanKenyaKoreaKuwaitLaosLatin AmericaLatviaLebanonLiberiaLithuaniaMalaysiaMexicoMicronesiaMiddle AfricaMoldovaMoroccoNepalNetherlandsNicaraguaNigeriaNorth AmericaNorth MacedoniaNorthern AfricaNorthern EuropeNorwayOceaniaPakistanPanamaPeruPhilippinesPolandPortugalRomaniaRussiaSaudi ArabiaScotlandSenegalSerbiaSierra LeoneSingaporeSomaliaSouth AfricaSouth AmericaSouth Central AsiaSouth Eastern AsiaSouthern EuropeSpainSri LankaSt. Vincent and the GrenadinesSudanSwedenSwitzerlandSyriaTaiwanThailandTrinidad and TobagoTurkeyUgandaUkraineUruguayUzbekistanVenezuelaVietnamWest IndiesWestern AfricaWestern AsiaWestern EuropeYemenZaireZimbabweAzores
Family Households
Income
Poverty
Unemployment
Labor Participation
Family Structure
Vehicle Availability
Education Level
Disability

Family Households Comparison

Russians

Panamanians

Tragic
Exceptional
63.4%
FAMILY HOUSEHOLDS
1.4/ 100
METRIC RATING
249th/ 347
METRIC RANK
64.8%
FAMILY HOUSEHOLDS
92.4/ 100
METRIC RATING
126th/ 347
METRIC RANK

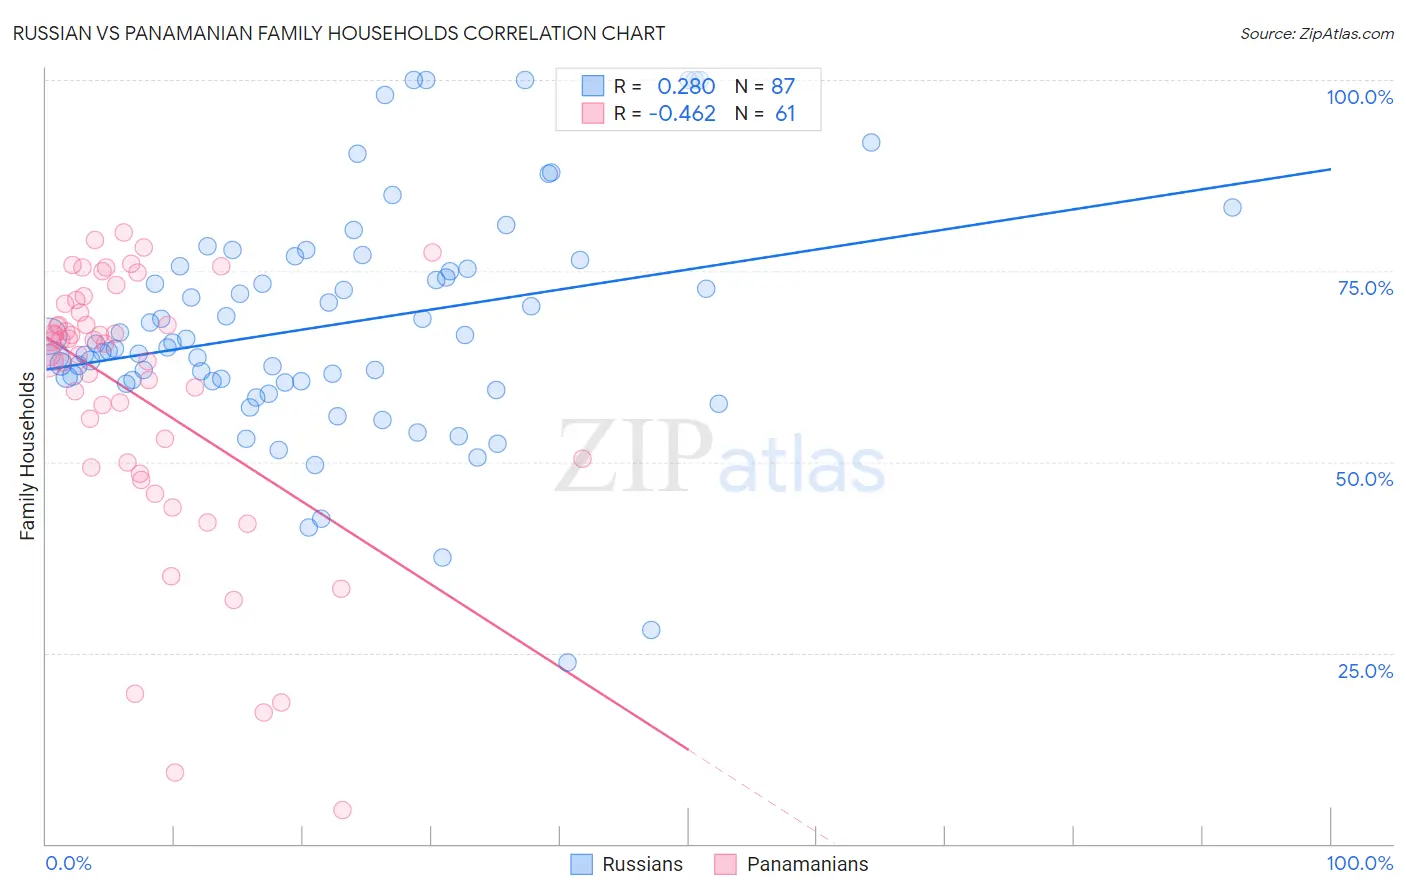
Russian vs Panamanian Family Households Correlation Chart

The statistical analysis conducted on geographies consisting of 511,741,989 people shows a weak positive correlation between the proportion of Russians and percentage of family households in the United States with a correlation coefficient (R) of 0.280 and weighted average of 63.4%. Similarly, the statistical analysis conducted on geographies consisting of 281,073,089 people shows a moderate negative correlation between the proportion of Panamanians and percentage of family households in the United States with a correlation coefficient (R) of -0.462 and weighted average of 64.8%, a difference of 2.3%.
Russian vs Panamanian Family Households

Family Households Correlation Summary

MeasurementRussianPanamanian
Minimum23.8%4.4%
Maximum100.0%80.0%
Range76.2%75.6%
Mean68.0%58.6%
Median65.5%65.5%
Interquartile 25% (IQ1)60.6%49.5%
Interquartile 75% (IQ3)75.7%70.1%
Interquartile Range (IQR)15.1%20.6%
Standard Deviation (Sample)15.2%17.8%
Standard Deviation (Population)15.1%17.7%

Similar Demographics by Family Households

Demographics Similar to Russians by Family Households

In terms of family households, the demographic groups most similar to Russians are Dominican (63.4%, a difference of 0.010%), Immigrants from Japan (63.4%, a difference of 0.010%), Immigrants from Uzbekistan (63.4%, a difference of 0.020%), Immigrants from Ghana (63.4%, a difference of 0.030%), and Eastern European (63.4%, a difference of 0.050%).
DemographicsRating | RankFamily Households
Immigrants | Israel
1.8
/100
|
#242
Tragic
63.4%
Immigrants | Czechoslovakia
1.8
/100
|
#243
Tragic
63.4%
Eastern Europeans
1.6
/100
|
#244
Tragic
63.4%
Immigrants | Dominica
1.6
/100
|
#245
Tragic
63.4%
Immigrants | Ghana
1.6
/100
|
#246
Tragic
63.4%
Immigrants | Uzbekistan
1.5
/100
|
#247
Tragic
63.4%
Dominicans
1.5
/100
|
#248
Tragic
63.4%
Russians
1.4
/100
|
#249
Tragic
63.4%
Immigrants | Japan
1.4
/100
|
#250
Tragic
63.4%
Taiwanese
1.2
/100
|
#251
Tragic
63.3%
Bahamians
1.1
/100
|
#252
Tragic
63.3%
Immigrants | Dominican Republic
1.0
/100
|
#253
Tragic
63.3%
Slovaks
1.0
/100
|
#254
Tragic
63.3%
Potawatomi
1.0
/100
|
#255
Tragic
63.3%
Luxembourgers
0.9
/100
|
#256
Tragic
63.3%

Demographics Similar to Panamanians by Family Households

In terms of family households, the demographic groups most similar to Panamanians are Immigrants from Argentina (64.9%, a difference of 0.020%), Immigrants from Belize (64.9%, a difference of 0.020%), Immigrants from Panama (64.8%, a difference of 0.020%), Italian (64.8%, a difference of 0.020%), and Hmong (64.9%, a difference of 0.050%).
DemographicsRating | RankFamily Households
Immigrants | Eastern Asia
94.4
/100
|
#119
Exceptional
64.9%
Immigrants | Oceania
94.2
/100
|
#120
Exceptional
64.9%
Hungarians
94.0
/100
|
#121
Exceptional
64.9%
Hmong
93.4
/100
|
#122
Exceptional
64.9%
Choctaw
93.4
/100
|
#123
Exceptional
64.9%
Immigrants | Argentina
92.8
/100
|
#124
Exceptional
64.9%
Immigrants | Belize
92.7
/100
|
#125
Exceptional
64.9%
Panamanians
92.4
/100
|
#126
Exceptional
64.8%
Immigrants | Panama
92.0
/100
|
#127
Exceptional
64.8%
Italians
91.9
/100
|
#128
Exceptional
64.8%
Immigrants | Ecuador
91.4
/100
|
#129
Exceptional
64.8%
Immigrants | Italy
90.2
/100
|
#130
Exceptional
64.8%
Immigrants | Nonimmigrants
90.1
/100
|
#131
Exceptional
64.8%
Cajuns
89.4
/100
|
#132
Excellent
64.8%
Belizeans
89.3
/100
|
#133
Excellent
64.8%