Okinawan vs Cape Verdean Currently Married
COMPARE
Okinawan
Cape Verdean
Currently Married
Currently Married Comparison
Okinawans
Cape Verdeans
47.4%
CURRENTLY MARRIED
85.3/ 100
METRIC RATING
125th/ 347
METRIC RANK
39.6%
CURRENTLY MARRIED
0.0/ 100
METRIC RATING
338th/ 347
METRIC RANK
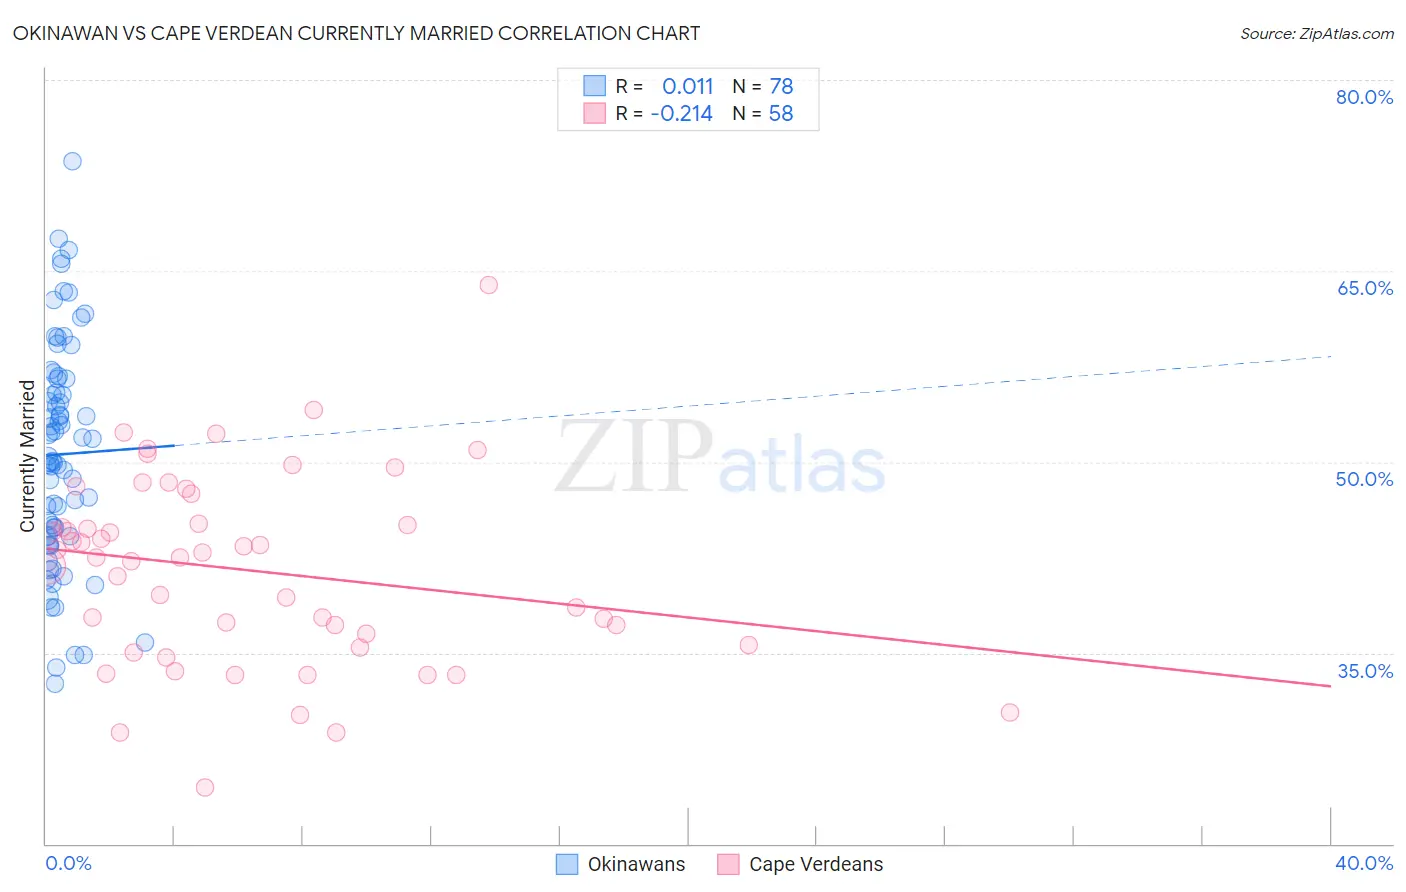
Okinawan vs Cape Verdean Currently Married Correlation Chart
The statistical analysis conducted on geographies consisting of 73,772,528 people shows no correlation between the proportion of Okinawans and percentage of population currently married in the United States with a correlation coefficient (R) of 0.011 and weighted average of 47.4%. Similarly, the statistical analysis conducted on geographies consisting of 107,578,938 people shows a weak negative correlation between the proportion of Cape Verdeans and percentage of population currently married in the United States with a correlation coefficient (R) of -0.214 and weighted average of 39.6%, a difference of 19.7%.
Currently Married Correlation Summary
| Measurement | Okinawan | Cape Verdean |
| Minimum | 32.6% | 24.4% |
| Maximum | 73.6% | 63.9% |
| Range | 41.0% | 39.5% |
| Mean | 50.6% | 41.5% |
| Median | 50.2% | 42.5% |
| Interquartile 25% (IQ1) | 44.2% | 35.6% |
| Interquartile 75% (IQ3) | 56.5% | 45.1% |
| Interquartile Range (IQR) | 12.3% | 9.5% |
| Standard Deviation (Sample) | 8.7% | 7.5% |
| Standard Deviation (Population) | 8.7% | 7.4% |
Similar Demographics by Currently Married
Demographics Similar to Okinawans by Currently Married
In terms of currently married, the demographic groups most similar to Okinawans are Immigrants from Jordan (47.4%, a difference of 0.030%), New Zealander (47.4%, a difference of 0.030%), Portuguese (47.3%, a difference of 0.080%), Laotian (47.4%, a difference of 0.10%), and Sri Lankan (47.3%, a difference of 0.14%).
| Demographics | Rating | Rank | Currently Married |
| Immigrants | Philippines | 90.2 /100 | #118 | Exceptional 47.6% |
| Australians | 90.2 /100 | #119 | Exceptional 47.6% |
| Syrians | 88.9 /100 | #120 | Excellent 47.5% |
| Immigrants | Croatia | 88.6 /100 | #121 | Excellent 47.5% |
| Osage | 87.9 /100 | #122 | Excellent 47.5% |
| Immigrants | Kazakhstan | 87.2 /100 | #123 | Excellent 47.4% |
| Laotians | 86.6 /100 | #124 | Excellent 47.4% |
| Okinawans | 85.3 /100 | #125 | Excellent 47.4% |
| Immigrants | Jordan | 84.9 /100 | #126 | Excellent 47.4% |
| New Zealanders | 84.9 /100 | #127 | Excellent 47.4% |
| Portuguese | 84.2 /100 | #128 | Excellent 47.3% |
| Sri Lankans | 83.2 /100 | #129 | Excellent 47.3% |
| Immigrants | Iraq | 82.8 /100 | #130 | Excellent 47.3% |
| Icelanders | 82.4 /100 | #131 | Excellent 47.3% |
| Afghans | 81.8 /100 | #132 | Excellent 47.3% |
Demographics Similar to Cape Verdeans by Currently Married
In terms of currently married, the demographic groups most similar to Cape Verdeans are Black/African American (39.6%, a difference of 0.090%), Dominican (39.5%, a difference of 0.15%), British West Indian (39.8%, a difference of 0.47%), Lumbee (39.8%, a difference of 0.65%), and Puerto Rican (39.9%, a difference of 0.81%).
| Demographics | Rating | Rank | Currently Married |
| Immigrants | Barbados | 0.0 /100 | #331 | Tragic 40.3% |
| Immigrants | St. Vincent and the Grenadines | 0.0 /100 | #332 | Tragic 40.1% |
| Yup'ik | 0.0 /100 | #333 | Tragic 39.9% |
| Puerto Ricans | 0.0 /100 | #334 | Tragic 39.9% |
| Lumbee | 0.0 /100 | #335 | Tragic 39.8% |
| British West Indians | 0.0 /100 | #336 | Tragic 39.8% |
| Blacks/African Americans | 0.0 /100 | #337 | Tragic 39.6% |
| Cape Verdeans | 0.0 /100 | #338 | Tragic 39.6% |
| Dominicans | 0.0 /100 | #339 | Tragic 39.5% |
| Immigrants | Grenada | 0.0 /100 | #340 | Tragic 39.1% |
| Navajo | 0.0 /100 | #341 | Tragic 39.0% |
| Immigrants | Dominican Republic | 0.0 /100 | #342 | Tragic 38.9% |
| Pueblo | 0.0 /100 | #343 | Tragic 38.2% |
| Immigrants | Cabo Verde | 0.0 /100 | #344 | Tragic 37.8% |
| Tohono O'odham | 0.0 /100 | #345 | Tragic 36.8% |