Okinawan vs Ethiopian Currently Married
COMPARE
Okinawan
Ethiopian
Currently Married
Currently Married Comparison
Okinawans
Ethiopians
47.4%
CURRENTLY MARRIED
85.3/ 100
METRIC RATING
125th/ 347
METRIC RANK
44.5%
CURRENTLY MARRIED
0.7/ 100
METRIC RATING
241st/ 347
METRIC RANK
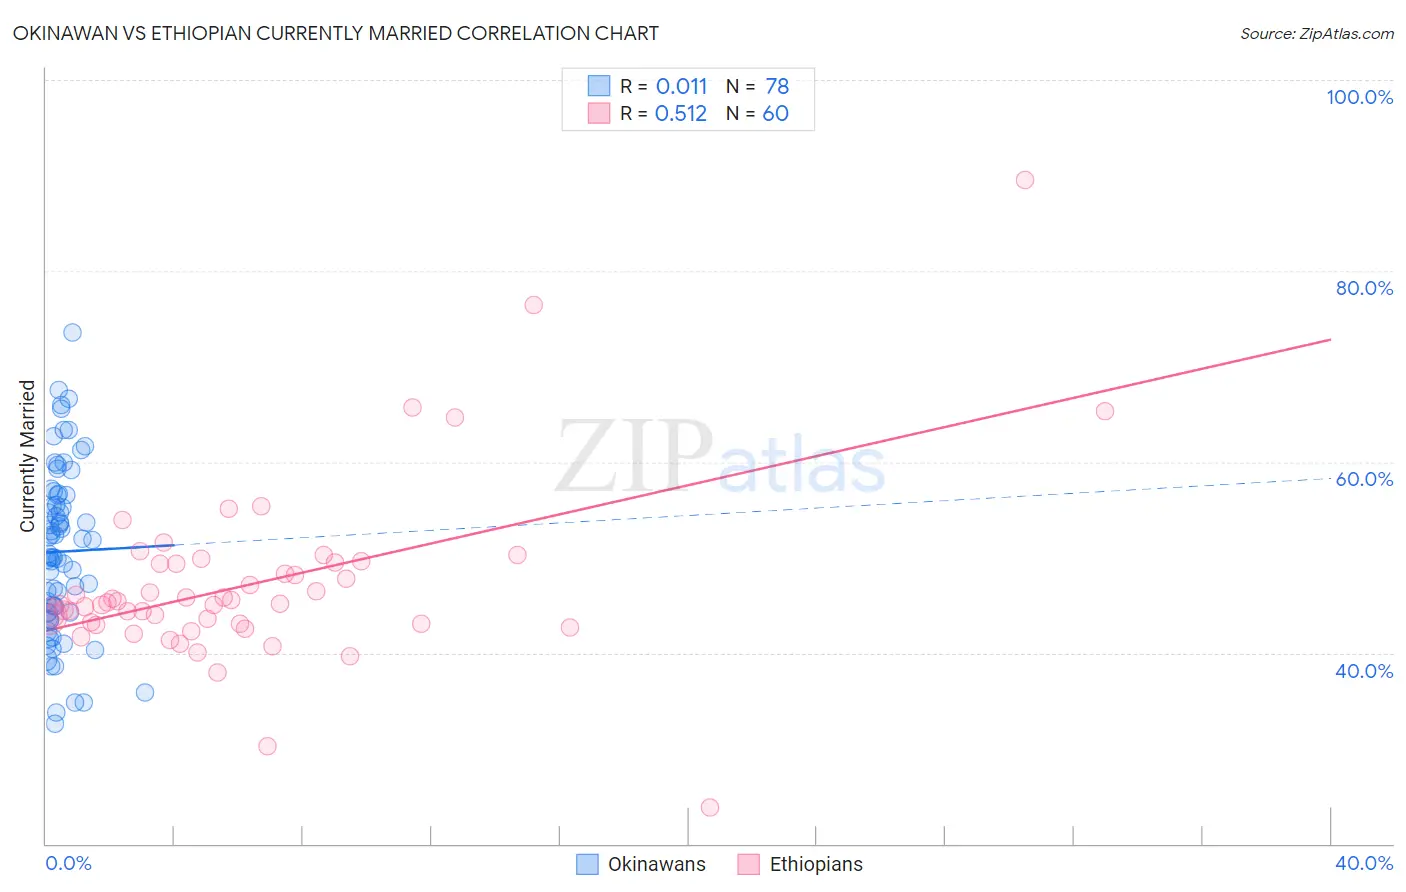
Okinawan vs Ethiopian Currently Married Correlation Chart
The statistical analysis conducted on geographies consisting of 73,772,528 people shows no correlation between the proportion of Okinawans and percentage of population currently married in the United States with a correlation coefficient (R) of 0.011 and weighted average of 47.4%. Similarly, the statistical analysis conducted on geographies consisting of 223,255,094 people shows a substantial positive correlation between the proportion of Ethiopians and percentage of population currently married in the United States with a correlation coefficient (R) of 0.512 and weighted average of 44.5%, a difference of 6.4%.
Currently Married Correlation Summary
| Measurement | Okinawan | Ethiopian |
| Minimum | 32.6% | 23.8% |
| Maximum | 73.6% | 89.5% |
| Range | 41.0% | 65.7% |
| Mean | 50.6% | 47.3% |
| Median | 50.2% | 45.2% |
| Interquartile 25% (IQ1) | 44.2% | 43.0% |
| Interquartile 75% (IQ3) | 56.5% | 49.4% |
| Interquartile Range (IQR) | 12.3% | 6.3% |
| Standard Deviation (Sample) | 8.7% | 9.5% |
| Standard Deviation (Population) | 8.7% | 9.4% |
Similar Demographics by Currently Married
Demographics Similar to Okinawans by Currently Married
In terms of currently married, the demographic groups most similar to Okinawans are Immigrants from Jordan (47.4%, a difference of 0.030%), New Zealander (47.4%, a difference of 0.030%), Portuguese (47.3%, a difference of 0.080%), Laotian (47.4%, a difference of 0.10%), and Sri Lankan (47.3%, a difference of 0.14%).
| Demographics | Rating | Rank | Currently Married |
| Immigrants | Philippines | 90.2 /100 | #118 | Exceptional 47.6% |
| Australians | 90.2 /100 | #119 | Exceptional 47.6% |
| Syrians | 88.9 /100 | #120 | Excellent 47.5% |
| Immigrants | Croatia | 88.6 /100 | #121 | Excellent 47.5% |
| Osage | 87.9 /100 | #122 | Excellent 47.5% |
| Immigrants | Kazakhstan | 87.2 /100 | #123 | Excellent 47.4% |
| Laotians | 86.6 /100 | #124 | Excellent 47.4% |
| Okinawans | 85.3 /100 | #125 | Excellent 47.4% |
| Immigrants | Jordan | 84.9 /100 | #126 | Excellent 47.4% |
| New Zealanders | 84.9 /100 | #127 | Excellent 47.4% |
| Portuguese | 84.2 /100 | #128 | Excellent 47.3% |
| Sri Lankans | 83.2 /100 | #129 | Excellent 47.3% |
| Immigrants | Iraq | 82.8 /100 | #130 | Excellent 47.3% |
| Icelanders | 82.4 /100 | #131 | Excellent 47.3% |
| Afghans | 81.8 /100 | #132 | Excellent 47.3% |
Demographics Similar to Ethiopians by Currently Married
In terms of currently married, the demographic groups most similar to Ethiopians are Immigrants from Cambodia (44.5%, a difference of 0.030%), Immigrants from Ethiopia (44.5%, a difference of 0.040%), Immigrants from Mexico (44.5%, a difference of 0.060%), Mexican American Indian (44.5%, a difference of 0.060%), and Japanese (44.5%, a difference of 0.12%).
| Demographics | Rating | Rank | Currently Married |
| Iroquois | 1.1 /100 | #234 | Tragic 44.7% |
| Alaskan Athabascans | 0.9 /100 | #235 | Tragic 44.6% |
| Cubans | 0.9 /100 | #236 | Tragic 44.6% |
| Seminole | 0.9 /100 | #237 | Tragic 44.6% |
| Moroccans | 0.9 /100 | #238 | Tragic 44.6% |
| Immigrants | Mexico | 0.7 /100 | #239 | Tragic 44.5% |
| Mexican American Indians | 0.7 /100 | #240 | Tragic 44.5% |
| Ethiopians | 0.7 /100 | #241 | Tragic 44.5% |
| Immigrants | Cambodia | 0.7 /100 | #242 | Tragic 44.5% |
| Immigrants | Ethiopia | 0.7 /100 | #243 | Tragic 44.5% |
| Japanese | 0.6 /100 | #244 | Tragic 44.5% |
| Immigrants | Armenia | 0.4 /100 | #245 | Tragic 44.3% |
| Immigrants | Burma/Myanmar | 0.4 /100 | #246 | Tragic 44.3% |
| Ugandans | 0.4 /100 | #247 | Tragic 44.2% |
| Nicaraguans | 0.3 /100 | #248 | Tragic 44.2% |