Okinawan vs Cape Verdean Doctorate Degree
COMPARE
Okinawan
Cape Verdean
Doctorate Degree
Doctorate Degree Comparison
Okinawans
Cape Verdeans
3.3%
DOCTORATE DEGREE
100.0/ 100
METRIC RATING
3rd/ 347
METRIC RANK
1.4%
DOCTORATE DEGREE
0.3/ 100
METRIC RATING
289th/ 347
METRIC RANK
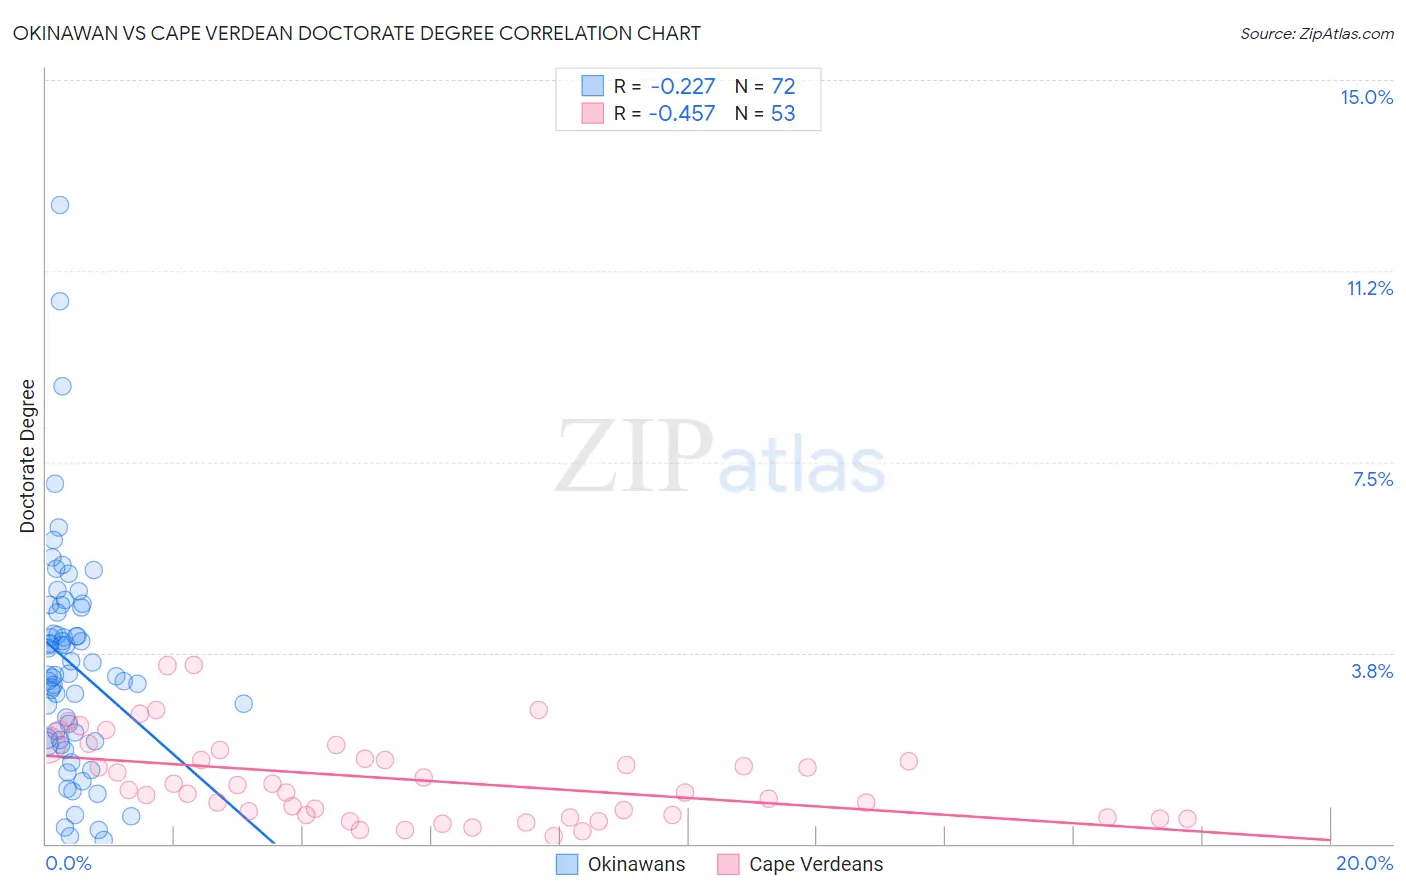
Okinawan vs Cape Verdean Doctorate Degree Correlation Chart
The statistical analysis conducted on geographies consisting of 73,671,875 people shows a weak negative correlation between the proportion of Okinawans and percentage of population with at least doctorate degree education in the United States with a correlation coefficient (R) of -0.227 and weighted average of 3.3%. Similarly, the statistical analysis conducted on geographies consisting of 107,405,258 people shows a moderate negative correlation between the proportion of Cape Verdeans and percentage of population with at least doctorate degree education in the United States with a correlation coefficient (R) of -0.457 and weighted average of 1.4%, a difference of 126.9%.
Doctorate Degree Correlation Summary
| Measurement | Okinawan | Cape Verdean |
| Minimum | 0.067% | 0.14% |
| Maximum | 12.6% | 3.5% |
| Range | 12.5% | 3.4% |
| Mean | 3.5% | 1.3% |
| Median | 3.3% | 1.1% |
| Interquartile 25% (IQ1) | 2.0% | 0.54% |
| Interquartile 75% (IQ3) | 4.6% | 1.7% |
| Interquartile Range (IQR) | 2.5% | 1.2% |
| Standard Deviation (Sample) | 2.2% | 0.83% |
| Standard Deviation (Population) | 2.2% | 0.82% |
Similar Demographics by Doctorate Degree
Demographics Similar to Okinawans by Doctorate Degree
In terms of doctorate degree, the demographic groups most similar to Okinawans are Immigrants from Taiwan (3.2%, a difference of 2.6%), Iranian (3.1%, a difference of 4.2%), Filipino (3.4%, a difference of 4.7%), Immigrants from Switzerland (3.1%, a difference of 6.2%), and Immigrants from China (3.1%, a difference of 6.3%).
| Demographics | Rating | Rank | Doctorate Degree |
| Immigrants | Singapore | 100.0 /100 | #1 | Exceptional 3.7% |
| Filipinos | 100.0 /100 | #2 | Exceptional 3.4% |
| Okinawans | 100.0 /100 | #3 | Exceptional 3.3% |
| Immigrants | Taiwan | 100.0 /100 | #4 | Exceptional 3.2% |
| Iranians | 100.0 /100 | #5 | Exceptional 3.1% |
| Immigrants | Switzerland | 100.0 /100 | #6 | Exceptional 3.1% |
| Immigrants | China | 100.0 /100 | #7 | Exceptional 3.1% |
| Immigrants | Israel | 100.0 /100 | #8 | Exceptional 3.0% |
| Immigrants | Iran | 100.0 /100 | #9 | Exceptional 3.0% |
| Immigrants | Eastern Asia | 100.0 /100 | #10 | Exceptional 3.0% |
| Indians (Asian) | 100.0 /100 | #11 | Exceptional 2.9% |
| Immigrants | Belgium | 100.0 /100 | #12 | Exceptional 2.9% |
| Immigrants | Sweden | 100.0 /100 | #13 | Exceptional 2.9% |
| Immigrants | France | 100.0 /100 | #14 | Exceptional 2.9% |
| Immigrants | India | 100.0 /100 | #15 | Exceptional 2.8% |
Demographics Similar to Cape Verdeans by Doctorate Degree
In terms of doctorate degree, the demographic groups most similar to Cape Verdeans are Choctaw (1.4%, a difference of 0.020%), Immigrants from El Salvador (1.4%, a difference of 0.14%), Black/African American (1.4%, a difference of 0.24%), Cajun (1.5%, a difference of 0.31%), and Alaska Native (1.4%, a difference of 0.42%).
| Demographics | Rating | Rank | Doctorate Degree |
| British West Indians | 0.3 /100 | #282 | Tragic 1.5% |
| Central Americans | 0.3 /100 | #283 | Tragic 1.5% |
| Jamaicans | 0.3 /100 | #284 | Tragic 1.5% |
| Malaysians | 0.3 /100 | #285 | Tragic 1.5% |
| Cherokee | 0.3 /100 | #286 | Tragic 1.5% |
| Cajuns | 0.3 /100 | #287 | Tragic 1.5% |
| Immigrants | El Salvador | 0.3 /100 | #288 | Tragic 1.4% |
| Cape Verdeans | 0.3 /100 | #289 | Tragic 1.4% |
| Choctaw | 0.3 /100 | #290 | Tragic 1.4% |
| Blacks/African Americans | 0.3 /100 | #291 | Tragic 1.4% |
| Alaska Natives | 0.3 /100 | #292 | Tragic 1.4% |
| Immigrants | Yemen | 0.2 /100 | #293 | Tragic 1.4% |
| Samoans | 0.2 /100 | #294 | Tragic 1.4% |
| Guatemalans | 0.2 /100 | #295 | Tragic 1.4% |
| Immigrants | Ecuador | 0.2 /100 | #296 | Tragic 1.4% |