Menominee vs Immigrants from Spain Married-couple Households
COMPARE
Menominee
Immigrants from Spain
Married-couple Households
Married-couple Households Comparison
Menominee
Immigrants from Spain
42.0%
MARRIED-COUPLE HOUSEHOLDS
0.0/ 100
METRIC RATING
293rd/ 347
METRIC RANK
45.3%
MARRIED-COUPLE HOUSEHOLDS
7.3/ 100
METRIC RATING
211th/ 347
METRIC RANK
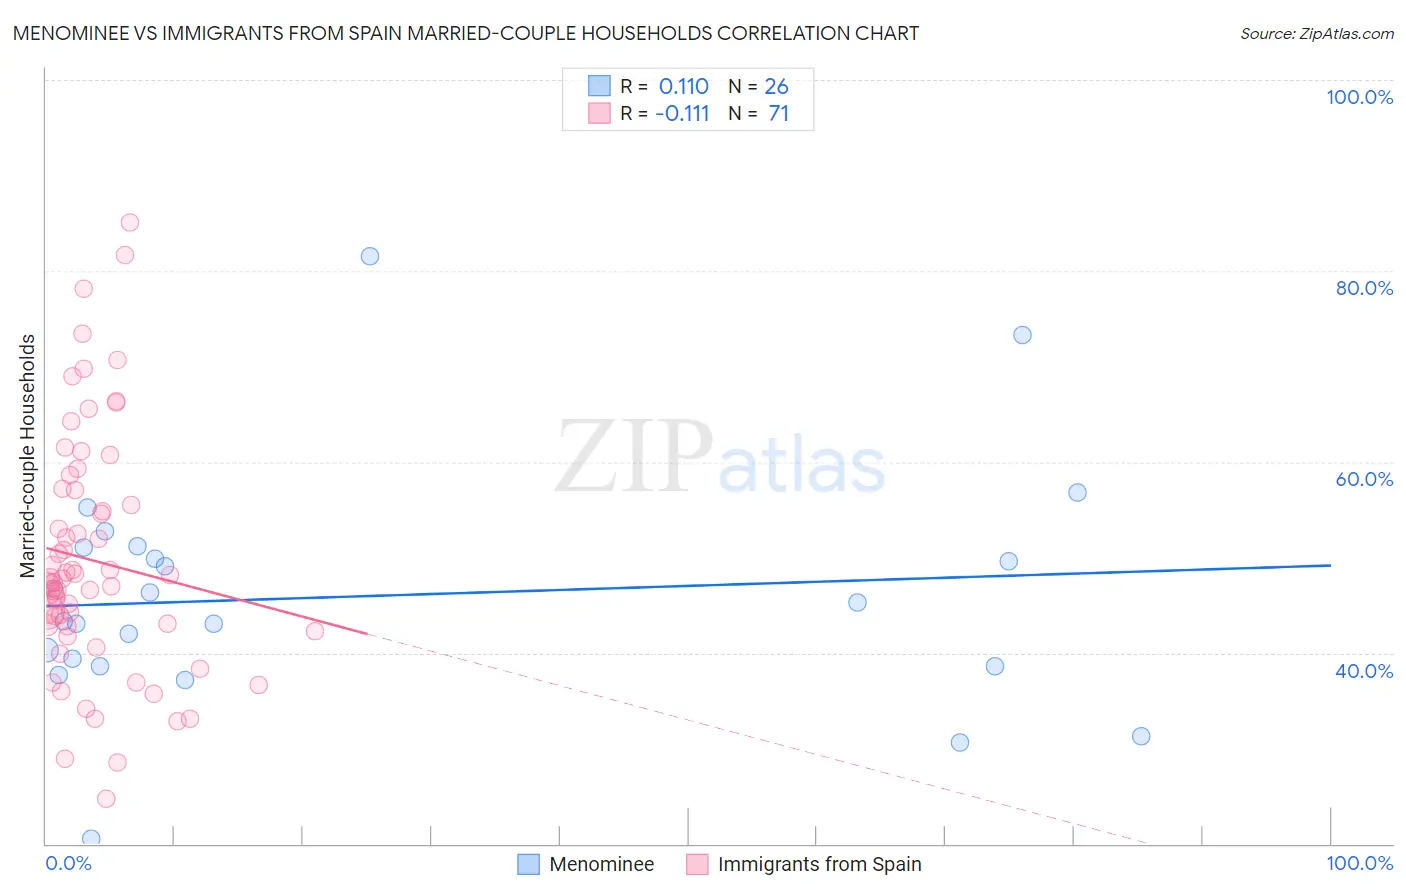
Menominee vs Immigrants from Spain Married-couple Households Correlation Chart
The statistical analysis conducted on geographies consisting of 45,777,849 people shows a poor positive correlation between the proportion of Menominee and percentage of married-couple family households in the United States with a correlation coefficient (R) of 0.110 and weighted average of 42.0%. Similarly, the statistical analysis conducted on geographies consisting of 239,598,425 people shows a poor negative correlation between the proportion of Immigrants from Spain and percentage of married-couple family households in the United States with a correlation coefficient (R) of -0.111 and weighted average of 45.3%, a difference of 8.0%.
Married-couple Households Correlation Summary
| Measurement | Menominee | Immigrants from Spain |
| Minimum | 20.5% | 24.7% |
| Maximum | 81.5% | 85.1% |
| Range | 61.0% | 60.3% |
| Mean | 45.9% | 49.7% |
| Median | 44.3% | 47.4% |
| Interquartile 25% (IQ1) | 38.6% | 42.8% |
| Interquartile 75% (IQ3) | 51.0% | 57.0% |
| Interquartile Range (IQR) | 12.4% | 14.2% |
| Standard Deviation (Sample) | 12.4% | 12.5% |
| Standard Deviation (Population) | 12.1% | 12.4% |
Similar Demographics by Married-couple Households
Demographics Similar to Menominee by Married-couple Households
In terms of married-couple households, the demographic groups most similar to Menominee are Immigrants from Yemen (42.0%, a difference of 0.0%), Kiowa (42.0%, a difference of 0.0%), Indonesian (42.0%, a difference of 0.11%), Immigrants from Sudan (41.9%, a difference of 0.11%), and Paiute (42.1%, a difference of 0.16%).
| Demographics | Rating | Rank | Married-couple Households |
| Belizeans | 0.0 /100 | #286 | Tragic 42.2% |
| Chippewa | 0.0 /100 | #287 | Tragic 42.1% |
| Immigrants | Eritrea | 0.0 /100 | #288 | Tragic 42.1% |
| Sudanese | 0.0 /100 | #289 | Tragic 42.1% |
| Hondurans | 0.0 /100 | #290 | Tragic 42.1% |
| Paiute | 0.0 /100 | #291 | Tragic 42.1% |
| Indonesians | 0.0 /100 | #292 | Tragic 42.0% |
| Menominee | 0.0 /100 | #293 | Tragic 42.0% |
| Immigrants | Yemen | 0.0 /100 | #294 | Tragic 42.0% |
| Kiowa | 0.0 /100 | #295 | Tragic 42.0% |
| Immigrants | Sudan | 0.0 /100 | #296 | Tragic 41.9% |
| Arapaho | 0.0 /100 | #297 | Tragic 41.8% |
| Immigrants | Middle Africa | 0.0 /100 | #298 | Tragic 41.8% |
| Immigrants | Ghana | 0.0 /100 | #299 | Tragic 41.8% |
| Immigrants | Belize | 0.0 /100 | #300 | Tragic 41.8% |
Demographics Similar to Immigrants from Spain by Married-couple Households
In terms of married-couple households, the demographic groups most similar to Immigrants from Spain are Cuban (45.4%, a difference of 0.050%), Creek (45.3%, a difference of 0.13%), Immigrants from Uzbekistan (45.4%, a difference of 0.14%), Immigrants from France (45.4%, a difference of 0.19%), and Hispanic or Latino (45.4%, a difference of 0.19%).
| Demographics | Rating | Rank | Married-couple Households |
| Aleuts | 12.5 /100 | #204 | Poor 45.6% |
| Nepalese | 11.9 /100 | #205 | Poor 45.6% |
| Uruguayans | 10.4 /100 | #206 | Poor 45.5% |
| Immigrants | France | 8.8 /100 | #207 | Tragic 45.4% |
| Hispanics or Latinos | 8.7 /100 | #208 | Tragic 45.4% |
| Immigrants | Uzbekistan | 8.4 /100 | #209 | Tragic 45.4% |
| Cubans | 7.7 /100 | #210 | Tragic 45.4% |
| Immigrants | Spain | 7.3 /100 | #211 | Tragic 45.3% |
| Creek | 6.4 /100 | #212 | Tragic 45.3% |
| Yakama | 5.8 /100 | #213 | Tragic 45.2% |
| Japanese | 5.7 /100 | #214 | Tragic 45.2% |
| Immigrants | Nepal | 5.6 /100 | #215 | Tragic 45.2% |
| Immigrants | Portugal | 5.6 /100 | #216 | Tragic 45.2% |
| Panamanians | 5.5 /100 | #217 | Tragic 45.2% |
| Immigrants | Azores | 5.3 /100 | #218 | Tragic 45.2% |