Maltese vs Immigrants from Hungary Single Father Households
COMPARE
Maltese
Immigrants from Hungary
Single Father Households
Single Father Households Comparison
Maltese
Immigrants from Hungary
2.0%
SINGLE FATHER HOUSEHOLDS
99.9/ 100
METRIC RATING
63rd/ 347
METRIC RANK
2.1%
SINGLE FATHER HOUSEHOLDS
99.6/ 100
METRIC RATING
85th/ 347
METRIC RANK
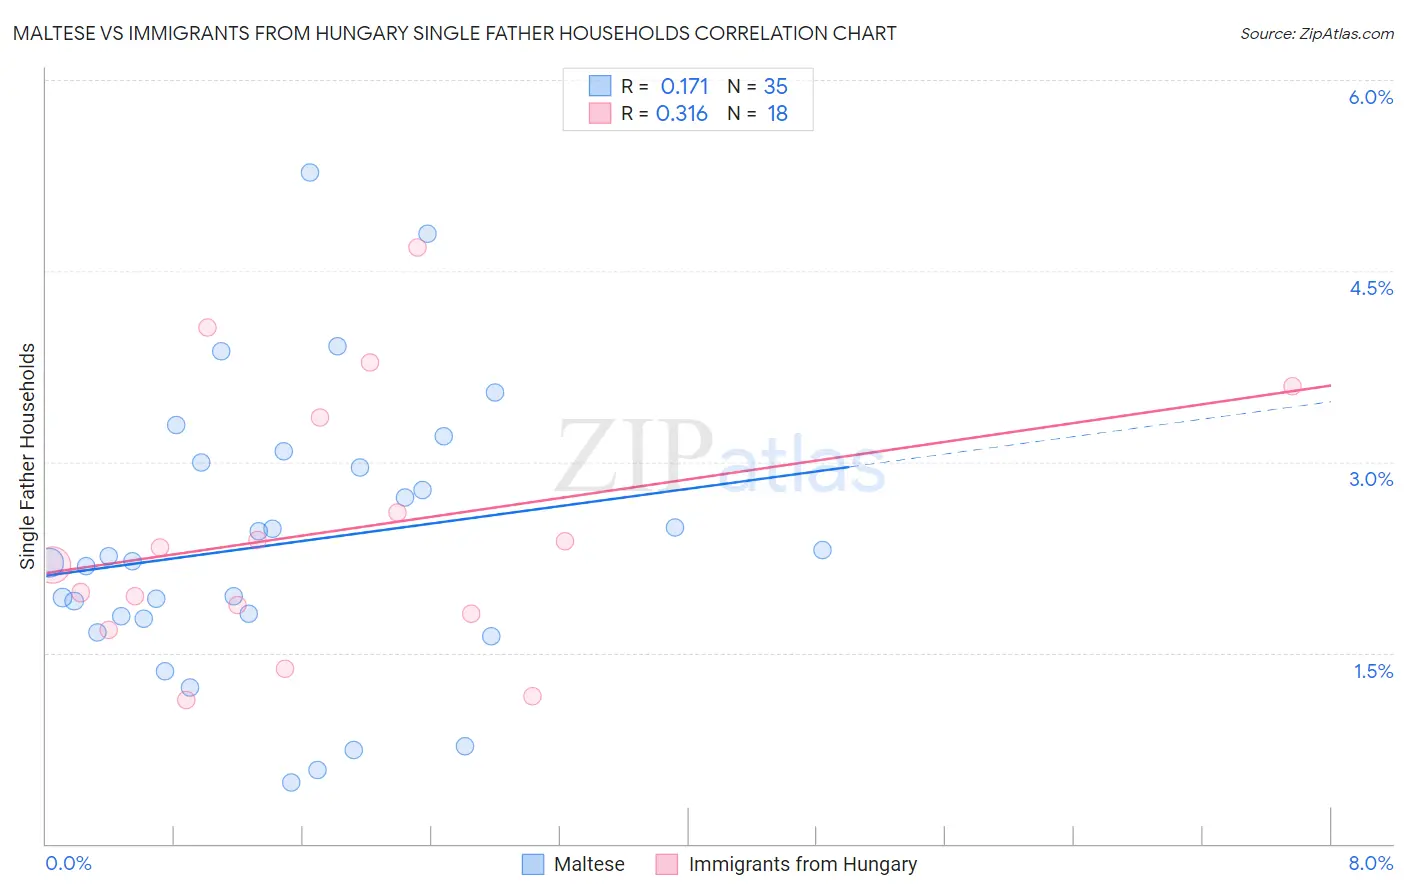
Maltese vs Immigrants from Hungary Single Father Households Correlation Chart
The statistical analysis conducted on geographies consisting of 125,770,300 people shows a poor positive correlation between the proportion of Maltese and percentage of single father households in the United States with a correlation coefficient (R) of 0.171 and weighted average of 2.0%. Similarly, the statistical analysis conducted on geographies consisting of 194,547,582 people shows a mild positive correlation between the proportion of Immigrants from Hungary and percentage of single father households in the United States with a correlation coefficient (R) of 0.316 and weighted average of 2.1%, a difference of 2.4%.
Single Father Households Correlation Summary
| Measurement | Maltese | Immigrants from Hungary |
| Minimum | 0.48% | 1.1% |
| Maximum | 5.3% | 4.7% |
| Range | 4.8% | 3.6% |
| Mean | 2.4% | 2.5% |
| Median | 2.2% | 2.3% |
| Interquartile 25% (IQ1) | 1.8% | 1.8% |
| Interquartile 75% (IQ3) | 3.0% | 3.3% |
| Interquartile Range (IQR) | 1.2% | 1.5% |
| Standard Deviation (Sample) | 1.1% | 1.0% |
| Standard Deviation (Population) | 1.1% | 1.00% |
Similar Demographics by Single Father Households
Demographics Similar to Maltese by Single Father Households
In terms of single father households, the demographic groups most similar to Maltese are Mongolian (2.1%, a difference of 0.14%), Paraguayan (2.1%, a difference of 0.17%), Immigrants from Malaysia (2.0%, a difference of 0.20%), Vietnamese (2.0%, a difference of 0.39%), and Immigrants from Western Asia (2.1%, a difference of 0.53%).
| Demographics | Rating | Rank | Single Father Households |
| Immigrants | Norway | 99.9 /100 | #56 | Exceptional 2.0% |
| Burmese | 99.9 /100 | #57 | Exceptional 2.0% |
| Immigrants | Czechoslovakia | 99.9 /100 | #58 | Exceptional 2.0% |
| Immigrants | North Macedonia | 99.9 /100 | #59 | Exceptional 2.0% |
| Immigrants | Austria | 99.9 /100 | #60 | Exceptional 2.0% |
| Vietnamese | 99.9 /100 | #61 | Exceptional 2.0% |
| Immigrants | Malaysia | 99.9 /100 | #62 | Exceptional 2.0% |
| Maltese | 99.9 /100 | #63 | Exceptional 2.0% |
| Mongolians | 99.9 /100 | #64 | Exceptional 2.1% |
| Paraguayans | 99.9 /100 | #65 | Exceptional 2.1% |
| Immigrants | Western Asia | 99.8 /100 | #66 | Exceptional 2.1% |
| Immigrants | Italy | 99.8 /100 | #67 | Exceptional 2.1% |
| Immigrants | Denmark | 99.8 /100 | #68 | Exceptional 2.1% |
| Immigrants | Romania | 99.8 /100 | #69 | Exceptional 2.1% |
| Egyptians | 99.8 /100 | #70 | Exceptional 2.1% |
Demographics Similar to Immigrants from Hungary by Single Father Households
In terms of single father households, the demographic groups most similar to Immigrants from Hungary are Carpatho Rusyn (2.1%, a difference of 0.040%), Asian (2.1%, a difference of 0.080%), Greek (2.1%, a difference of 0.34%), New Zealander (2.1%, a difference of 0.35%), and Armenian (2.1%, a difference of 0.40%).
| Demographics | Rating | Rank | Single Father Households |
| Estonians | 99.7 /100 | #78 | Exceptional 2.1% |
| Immigrants | Asia | 99.7 /100 | #79 | Exceptional 2.1% |
| Immigrants | South Africa | 99.7 /100 | #80 | Exceptional 2.1% |
| Armenians | 99.7 /100 | #81 | Exceptional 2.1% |
| New Zealanders | 99.7 /100 | #82 | Exceptional 2.1% |
| Greeks | 99.7 /100 | #83 | Exceptional 2.1% |
| Carpatho Rusyns | 99.6 /100 | #84 | Exceptional 2.1% |
| Immigrants | Hungary | 99.6 /100 | #85 | Exceptional 2.1% |
| Asians | 99.6 /100 | #86 | Exceptional 2.1% |
| Lithuanians | 99.5 /100 | #87 | Exceptional 2.1% |
| Bhutanese | 99.5 /100 | #88 | Exceptional 2.1% |
| Immigrants | Armenia | 99.5 /100 | #89 | Exceptional 2.1% |
| Immigrants | Pakistan | 99.5 /100 | #90 | Exceptional 2.1% |
| Immigrants | Guyana | 99.4 /100 | #91 | Exceptional 2.1% |
| Romanians | 99.4 /100 | #92 | Exceptional 2.1% |