Maltese vs Barbadian Single Father Households
COMPARE
Maltese
Barbadian
Single Father Households
Single Father Households Comparison
Maltese
Barbadians
2.0%
SINGLE FATHER HOUSEHOLDS
99.9/ 100
METRIC RATING
63rd/ 347
METRIC RANK
2.2%
SINGLE FATHER HOUSEHOLDS
98.4/ 100
METRIC RATING
109th/ 347
METRIC RANK
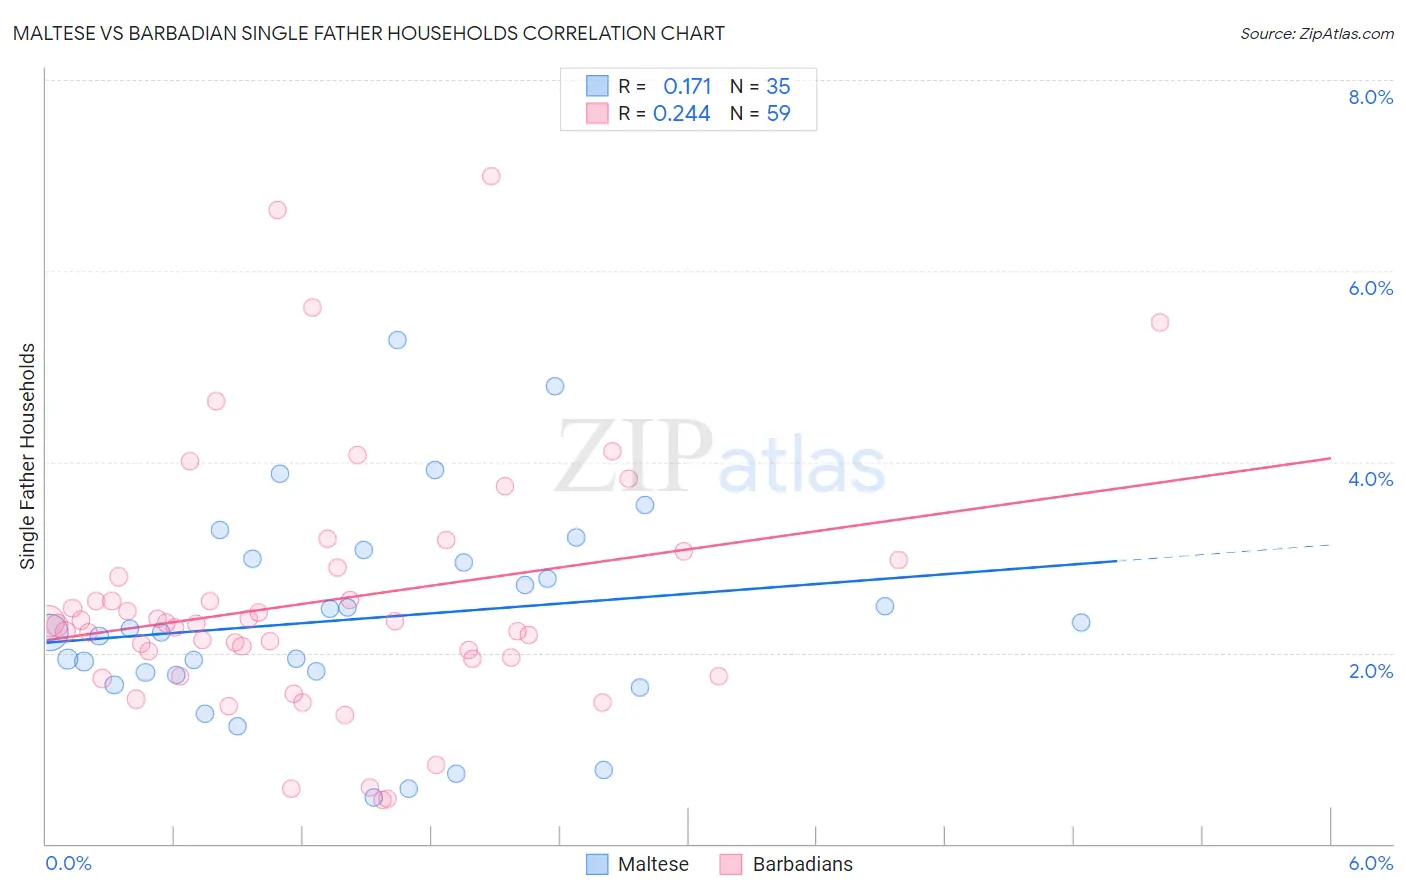
Maltese vs Barbadian Single Father Households Correlation Chart
The statistical analysis conducted on geographies consisting of 125,770,300 people shows a poor positive correlation between the proportion of Maltese and percentage of single father households in the United States with a correlation coefficient (R) of 0.171 and weighted average of 2.0%. Similarly, the statistical analysis conducted on geographies consisting of 140,972,494 people shows a weak positive correlation between the proportion of Barbadians and percentage of single father households in the United States with a correlation coefficient (R) of 0.244 and weighted average of 2.2%, a difference of 5.4%.
Single Father Households Correlation Summary
| Measurement | Maltese | Barbadian |
| Minimum | 0.48% | 0.46% |
| Maximum | 5.3% | 7.0% |
| Range | 4.8% | 6.5% |
| Mean | 2.4% | 2.5% |
| Median | 2.2% | 2.3% |
| Interquartile 25% (IQ1) | 1.8% | 1.9% |
| Interquartile 75% (IQ3) | 3.0% | 2.9% |
| Interquartile Range (IQR) | 1.2% | 0.95% |
| Standard Deviation (Sample) | 1.1% | 1.3% |
| Standard Deviation (Population) | 1.1% | 1.3% |
Similar Demographics by Single Father Households
Demographics Similar to Maltese by Single Father Households
In terms of single father households, the demographic groups most similar to Maltese are Mongolian (2.1%, a difference of 0.14%), Paraguayan (2.1%, a difference of 0.17%), Immigrants from Malaysia (2.0%, a difference of 0.20%), Vietnamese (2.0%, a difference of 0.39%), and Immigrants from Western Asia (2.1%, a difference of 0.53%).
| Demographics | Rating | Rank | Single Father Households |
| Immigrants | Norway | 99.9 /100 | #56 | Exceptional 2.0% |
| Burmese | 99.9 /100 | #57 | Exceptional 2.0% |
| Immigrants | Czechoslovakia | 99.9 /100 | #58 | Exceptional 2.0% |
| Immigrants | North Macedonia | 99.9 /100 | #59 | Exceptional 2.0% |
| Immigrants | Austria | 99.9 /100 | #60 | Exceptional 2.0% |
| Vietnamese | 99.9 /100 | #61 | Exceptional 2.0% |
| Immigrants | Malaysia | 99.9 /100 | #62 | Exceptional 2.0% |
| Maltese | 99.9 /100 | #63 | Exceptional 2.0% |
| Mongolians | 99.9 /100 | #64 | Exceptional 2.1% |
| Paraguayans | 99.9 /100 | #65 | Exceptional 2.1% |
| Immigrants | Western Asia | 99.8 /100 | #66 | Exceptional 2.1% |
| Immigrants | Italy | 99.8 /100 | #67 | Exceptional 2.1% |
| Immigrants | Denmark | 99.8 /100 | #68 | Exceptional 2.1% |
| Immigrants | Romania | 99.8 /100 | #69 | Exceptional 2.1% |
| Egyptians | 99.8 /100 | #70 | Exceptional 2.1% |
Demographics Similar to Barbadians by Single Father Households
In terms of single father households, the demographic groups most similar to Barbadians are Immigrants from Netherlands (2.2%, a difference of 0.040%), Slovene (2.2%, a difference of 0.060%), Italian (2.2%, a difference of 0.13%), Immigrants from Southern Europe (2.2%, a difference of 0.17%), and Immigrants from Canada (2.2%, a difference of 0.21%).
| Demographics | Rating | Rank | Single Father Households |
| Argentineans | 98.9 /100 | #102 | Exceptional 2.1% |
| Lebanese | 98.9 /100 | #103 | Exceptional 2.1% |
| Alsatians | 98.9 /100 | #104 | Exceptional 2.1% |
| Palestinians | 98.6 /100 | #105 | Exceptional 2.2% |
| Immigrants | Southern Europe | 98.6 /100 | #106 | Exceptional 2.2% |
| Slovenes | 98.5 /100 | #107 | Exceptional 2.2% |
| Immigrants | Netherlands | 98.5 /100 | #108 | Exceptional 2.2% |
| Barbadians | 98.4 /100 | #109 | Exceptional 2.2% |
| Italians | 98.3 /100 | #110 | Exceptional 2.2% |
| Immigrants | Canada | 98.3 /100 | #111 | Exceptional 2.2% |
| Immigrants | Trinidad and Tobago | 98.2 /100 | #112 | Exceptional 2.2% |
| Iraqis | 98.2 /100 | #113 | Exceptional 2.2% |
| Immigrants | North America | 98.2 /100 | #114 | Exceptional 2.2% |
| Immigrants | Barbados | 98.2 /100 | #115 | Exceptional 2.2% |
| Immigrants | Argentina | 98.1 /100 | #116 | Exceptional 2.2% |