Immigrants from Turkey vs Immigrants from Hungary Single Father Households
COMPARE
Immigrants from Turkey
Immigrants from Hungary
Single Father Households
Single Father Households Comparison
Immigrants from Turkey
Immigrants from Hungary
2.0%
SINGLE FATHER HOUSEHOLDS
100.0/ 100
METRIC RATING
41st/ 347
METRIC RANK
2.1%
SINGLE FATHER HOUSEHOLDS
99.6/ 100
METRIC RATING
85th/ 347
METRIC RANK
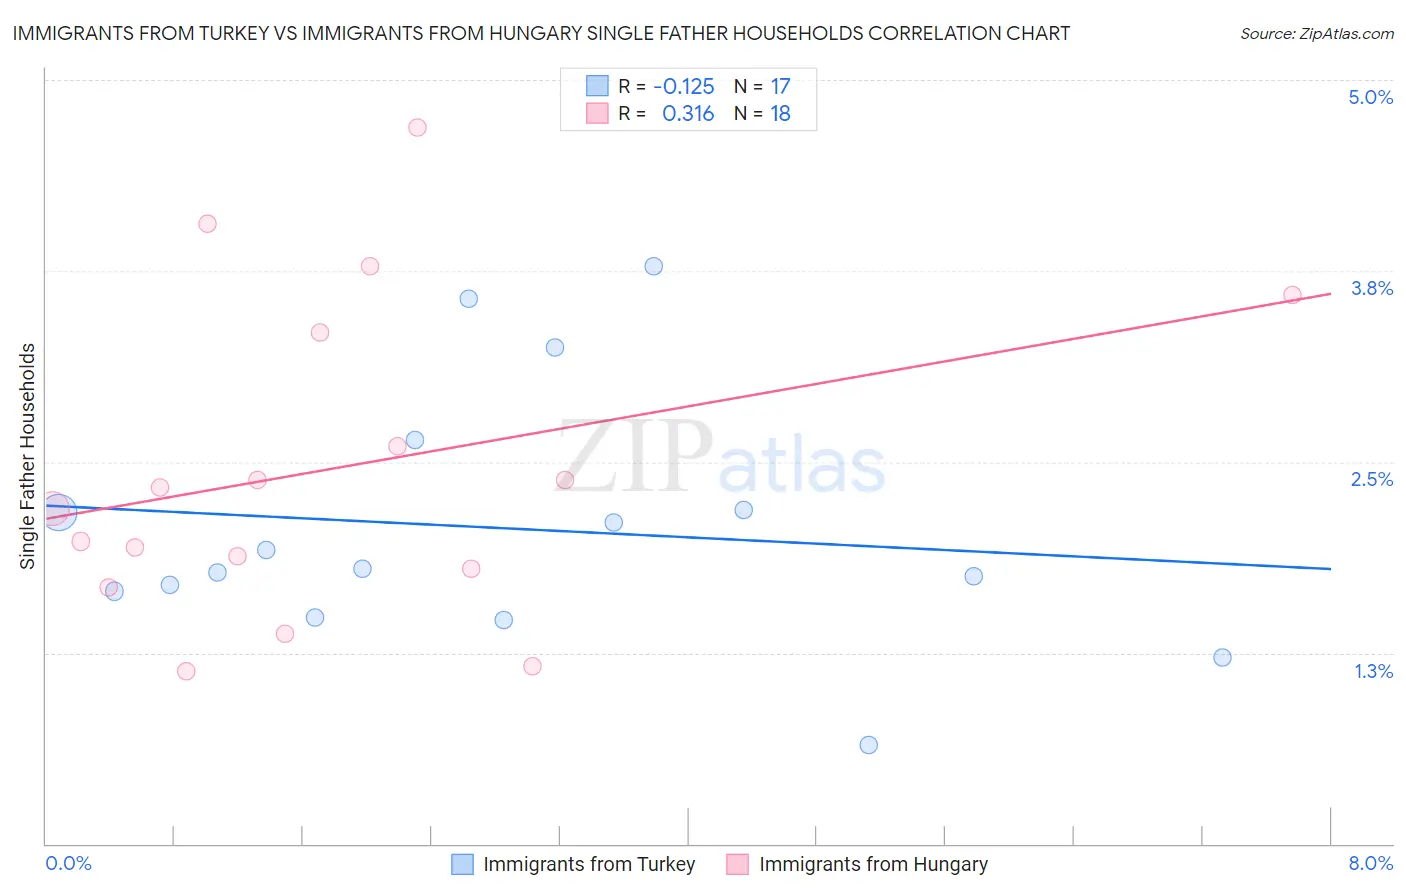
Immigrants from Turkey vs Immigrants from Hungary Single Father Households Correlation Chart
The statistical analysis conducted on geographies consisting of 221,918,090 people shows a poor negative correlation between the proportion of Immigrants from Turkey and percentage of single father households in the United States with a correlation coefficient (R) of -0.125 and weighted average of 2.0%. Similarly, the statistical analysis conducted on geographies consisting of 194,547,582 people shows a mild positive correlation between the proportion of Immigrants from Hungary and percentage of single father households in the United States with a correlation coefficient (R) of 0.316 and weighted average of 2.1%, a difference of 5.1%.
Single Father Households Correlation Summary
| Measurement | Immigrants from Turkey | Immigrants from Hungary |
| Minimum | 0.65% | 1.1% |
| Maximum | 3.8% | 4.7% |
| Range | 3.1% | 3.6% |
| Mean | 2.1% | 2.5% |
| Median | 1.8% | 2.3% |
| Interquartile 25% (IQ1) | 1.6% | 1.8% |
| Interquartile 75% (IQ3) | 2.4% | 3.3% |
| Interquartile Range (IQR) | 0.84% | 1.5% |
| Standard Deviation (Sample) | 0.83% | 1.0% |
| Standard Deviation (Population) | 0.80% | 1.00% |
Similar Demographics by Single Father Households
Demographics Similar to Immigrants from Turkey by Single Father Households
In terms of single father households, the demographic groups most similar to Immigrants from Turkey are Macedonian (2.0%, a difference of 0.15%), Immigrants from Bulgaria (2.0%, a difference of 0.18%), Immigrants from Eastern Europe (2.0%, a difference of 0.23%), Immigrants from Sri Lanka (2.0%, a difference of 0.23%), and Immigrants from Grenada (2.0%, a difference of 0.38%).
| Demographics | Rating | Rank | Single Father Households |
| Immigrants | Australia | 100.0 /100 | #34 | Exceptional 2.0% |
| Albanians | 100.0 /100 | #35 | Exceptional 2.0% |
| Immigrants | Belgium | 100.0 /100 | #36 | Exceptional 2.0% |
| Immigrants | St. Vincent and the Grenadines | 100.0 /100 | #37 | Exceptional 2.0% |
| Immigrants | Eastern Europe | 100.0 /100 | #38 | Exceptional 2.0% |
| Immigrants | Sri Lanka | 100.0 /100 | #39 | Exceptional 2.0% |
| Immigrants | Bulgaria | 100.0 /100 | #40 | Exceptional 2.0% |
| Immigrants | Turkey | 100.0 /100 | #41 | Exceptional 2.0% |
| Macedonians | 100.0 /100 | #42 | Exceptional 2.0% |
| Immigrants | Grenada | 100.0 /100 | #43 | Exceptional 2.0% |
| Latvians | 100.0 /100 | #44 | Exceptional 2.0% |
| Russians | 100.0 /100 | #45 | Exceptional 2.0% |
| Immigrants | Lebanon | 100.0 /100 | #46 | Exceptional 2.0% |
| Immigrants | Ukraine | 99.9 /100 | #47 | Exceptional 2.0% |
| Immigrants | Kazakhstan | 99.9 /100 | #48 | Exceptional 2.0% |
Demographics Similar to Immigrants from Hungary by Single Father Households
In terms of single father households, the demographic groups most similar to Immigrants from Hungary are Carpatho Rusyn (2.1%, a difference of 0.040%), Asian (2.1%, a difference of 0.080%), Greek (2.1%, a difference of 0.34%), New Zealander (2.1%, a difference of 0.35%), and Armenian (2.1%, a difference of 0.40%).
| Demographics | Rating | Rank | Single Father Households |
| Estonians | 99.7 /100 | #78 | Exceptional 2.1% |
| Immigrants | Asia | 99.7 /100 | #79 | Exceptional 2.1% |
| Immigrants | South Africa | 99.7 /100 | #80 | Exceptional 2.1% |
| Armenians | 99.7 /100 | #81 | Exceptional 2.1% |
| New Zealanders | 99.7 /100 | #82 | Exceptional 2.1% |
| Greeks | 99.7 /100 | #83 | Exceptional 2.1% |
| Carpatho Rusyns | 99.6 /100 | #84 | Exceptional 2.1% |
| Immigrants | Hungary | 99.6 /100 | #85 | Exceptional 2.1% |
| Asians | 99.6 /100 | #86 | Exceptional 2.1% |
| Lithuanians | 99.5 /100 | #87 | Exceptional 2.1% |
| Bhutanese | 99.5 /100 | #88 | Exceptional 2.1% |
| Immigrants | Armenia | 99.5 /100 | #89 | Exceptional 2.1% |
| Immigrants | Pakistan | 99.5 /100 | #90 | Exceptional 2.1% |
| Immigrants | Guyana | 99.4 /100 | #91 | Exceptional 2.1% |
| Romanians | 99.4 /100 | #92 | Exceptional 2.1% |