Maltese vs Immigrants from Afghanistan Family Households
COMPARE
Maltese
Immigrants from Afghanistan
Family Households
Family Households Comparison
Maltese
Immigrants from Afghanistan
64.7%
FAMILY HOUSEHOLDS
87.4/ 100
METRIC RATING
135th/ 347
METRIC RANK
65.9%
FAMILY HOUSEHOLDS
99.9/ 100
METRIC RATING
70th/ 347
METRIC RANK
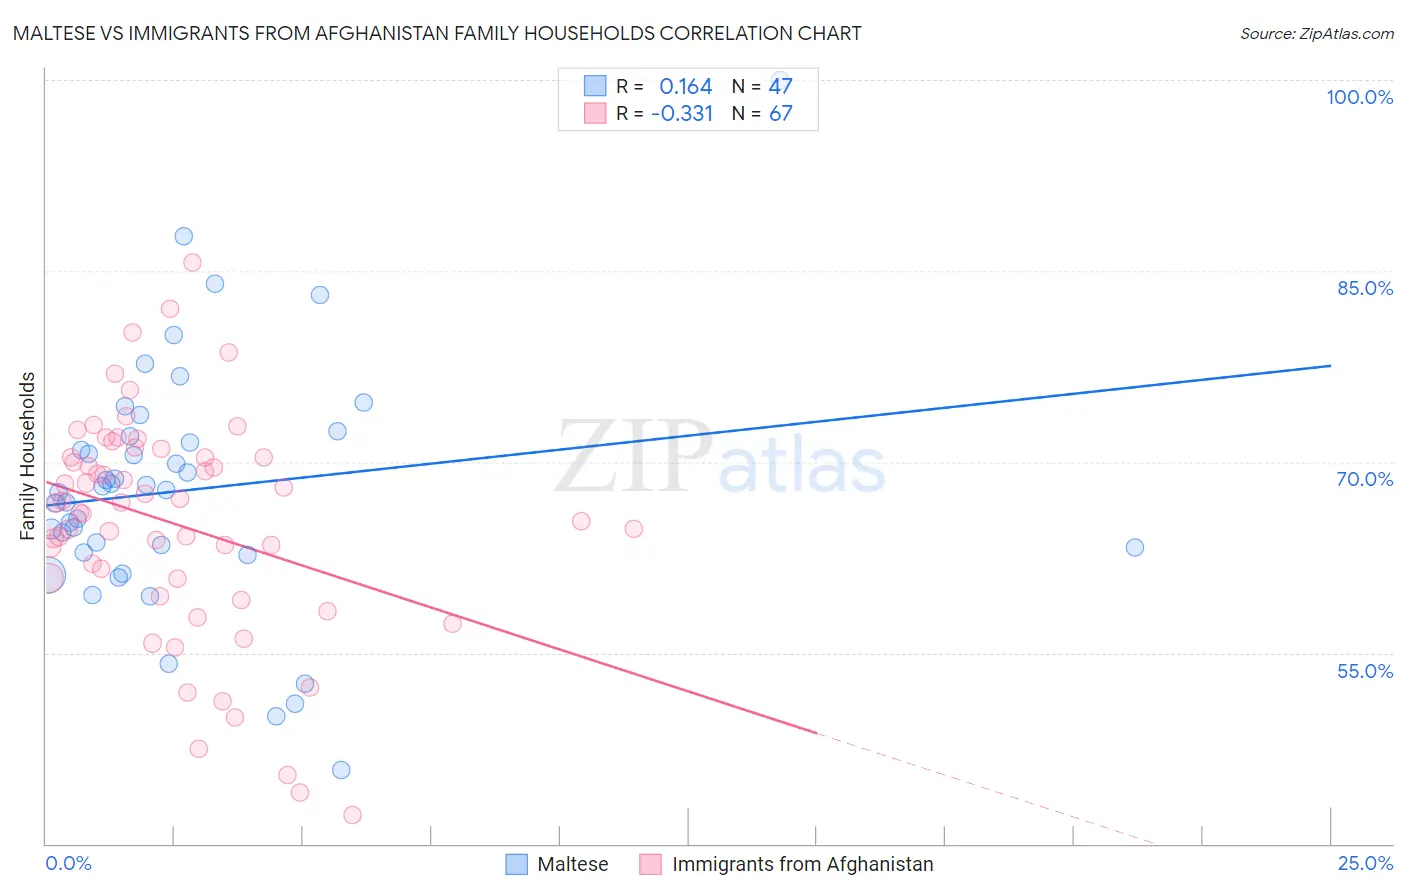
Maltese vs Immigrants from Afghanistan Family Households Correlation Chart
The statistical analysis conducted on geographies consisting of 126,423,443 people shows a poor positive correlation between the proportion of Maltese and percentage of family households in the United States with a correlation coefficient (R) of 0.164 and weighted average of 64.7%. Similarly, the statistical analysis conducted on geographies consisting of 147,637,809 people shows a mild negative correlation between the proportion of Immigrants from Afghanistan and percentage of family households in the United States with a correlation coefficient (R) of -0.331 and weighted average of 65.9%, a difference of 1.8%.
Family Households Correlation Summary
| Measurement | Maltese | Immigrants from Afghanistan |
| Minimum | 45.8% | 42.3% |
| Maximum | 100.0% | 85.6% |
| Range | 54.2% | 43.4% |
| Mean | 67.8% | 65.1% |
| Median | 67.8% | 66.8% |
| Interquartile 25% (IQ1) | 62.9% | 60.8% |
| Interquartile 75% (IQ3) | 72.0% | 70.4% |
| Interquartile Range (IQR) | 9.1% | 9.6% |
| Standard Deviation (Sample) | 9.8% | 8.8% |
| Standard Deviation (Population) | 9.7% | 8.7% |
Similar Demographics by Family Households
Demographics Similar to Maltese by Family Households
In terms of family households, the demographic groups most similar to Maltese are Greek (64.7%, a difference of 0.020%), Immigrants from China (64.7%, a difference of 0.030%), Immigrants from Scotland (64.7%, a difference of 0.030%), Basque (64.7%, a difference of 0.050%), and Cajun (64.8%, a difference of 0.060%).
| Demographics | Rating | Rank | Family Households |
| Italians | 91.9 /100 | #128 | Exceptional 64.8% |
| Immigrants | Ecuador | 91.4 /100 | #129 | Exceptional 64.8% |
| Immigrants | Italy | 90.2 /100 | #130 | Exceptional 64.8% |
| Immigrants | Nonimmigrants | 90.1 /100 | #131 | Exceptional 64.8% |
| Cajuns | 89.4 /100 | #132 | Excellent 64.8% |
| Belizeans | 89.3 /100 | #133 | Excellent 64.8% |
| Greeks | 88.1 /100 | #134 | Excellent 64.7% |
| Maltese | 87.4 /100 | #135 | Excellent 64.7% |
| Immigrants | China | 86.6 /100 | #136 | Excellent 64.7% |
| Immigrants | Scotland | 86.4 /100 | #137 | Excellent 64.7% |
| Basques | 85.5 /100 | #138 | Excellent 64.7% |
| Immigrants | Jamaica | 85.3 /100 | #139 | Excellent 64.7% |
| Immigrants | North Macedonia | 84.9 /100 | #140 | Excellent 64.7% |
| Immigrants | Cameroon | 84.8 /100 | #141 | Excellent 64.7% |
| Pakistanis | 84.0 /100 | #142 | Excellent 64.7% |
Demographics Similar to Immigrants from Afghanistan by Family Households
In terms of family households, the demographic groups most similar to Immigrants from Afghanistan are Malaysian (65.9%, a difference of 0.010%), Bhutanese (65.9%, a difference of 0.020%), Japanese (65.9%, a difference of 0.040%), Fijian (65.9%, a difference of 0.060%), and Filipino (65.9%, a difference of 0.060%).
| Demographics | Rating | Rank | Family Households |
| Immigrants | Indonesia | 100.0 /100 | #63 | Exceptional 66.0% |
| Pima | 99.9 /100 | #64 | Exceptional 65.9% |
| Costa Ricans | 99.9 /100 | #65 | Exceptional 65.9% |
| Fijians | 99.9 /100 | #66 | Exceptional 65.9% |
| Filipinos | 99.9 /100 | #67 | Exceptional 65.9% |
| Japanese | 99.9 /100 | #68 | Exceptional 65.9% |
| Malaysians | 99.9 /100 | #69 | Exceptional 65.9% |
| Immigrants | Afghanistan | 99.9 /100 | #70 | Exceptional 65.9% |
| Bhutanese | 99.9 /100 | #71 | Exceptional 65.9% |
| Portuguese | 99.9 /100 | #72 | Exceptional 65.8% |
| Laotians | 99.9 /100 | #73 | Exceptional 65.8% |
| Burmese | 99.9 /100 | #74 | Exceptional 65.7% |
| Houma | 99.9 /100 | #75 | Exceptional 65.7% |
| Immigrants | Azores | 99.8 /100 | #76 | Exceptional 65.6% |
| Immigrants | South America | 99.8 /100 | #77 | Exceptional 65.6% |