Okinawan vs Barbadian Single Father Households
COMPARE
Okinawan
Barbadian
Single Father Households
Single Father Households Comparison
Okinawans
Barbadians
1.9%
SINGLE FATHER HOUSEHOLDS
100.0/ 100
METRIC RATING
10th/ 347
METRIC RANK
2.2%
SINGLE FATHER HOUSEHOLDS
98.4/ 100
METRIC RATING
109th/ 347
METRIC RANK
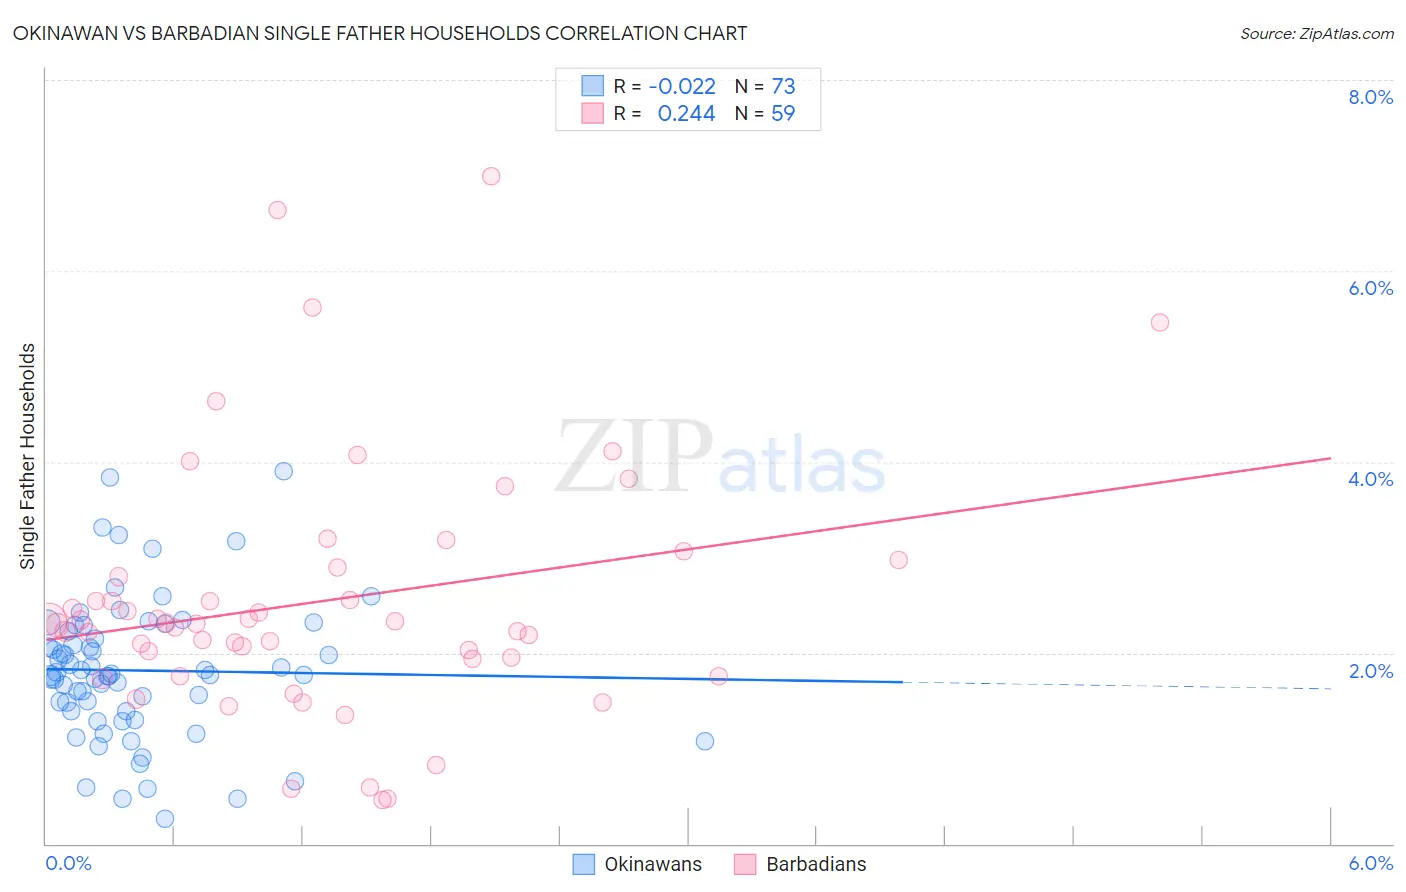
Okinawan vs Barbadian Single Father Households Correlation Chart
The statistical analysis conducted on geographies consisting of 73,621,147 people shows no correlation between the proportion of Okinawans and percentage of single father households in the United States with a correlation coefficient (R) of -0.022 and weighted average of 1.9%. Similarly, the statistical analysis conducted on geographies consisting of 140,972,494 people shows a weak positive correlation between the proportion of Barbadians and percentage of single father households in the United States with a correlation coefficient (R) of 0.244 and weighted average of 2.2%, a difference of 16.6%.
Single Father Households Correlation Summary
| Measurement | Okinawan | Barbadian |
| Minimum | 0.27% | 0.46% |
| Maximum | 3.9% | 7.0% |
| Range | 3.6% | 6.5% |
| Mean | 1.8% | 2.5% |
| Median | 1.8% | 2.3% |
| Interquartile 25% (IQ1) | 1.4% | 1.9% |
| Interquartile 75% (IQ3) | 2.3% | 2.9% |
| Interquartile Range (IQR) | 0.87% | 0.95% |
| Standard Deviation (Sample) | 0.73% | 1.3% |
| Standard Deviation (Population) | 0.72% | 1.3% |
Similar Demographics by Single Father Households
Demographics Similar to Okinawans by Single Father Households
In terms of single father households, the demographic groups most similar to Okinawans are Immigrants from Belarus (1.9%, a difference of 0.32%), Immigrants from China (1.8%, a difference of 0.36%), Immigrants from Ireland (1.8%, a difference of 0.50%), Cypriot (1.8%, a difference of 0.61%), and Immigrants from Taiwan (1.8%, a difference of 0.76%).
| Demographics | Rating | Rank | Single Father Households |
| Filipinos | 100.0 /100 | #3 | Exceptional 1.8% |
| Immigrants | Uzbekistan | 100.0 /100 | #4 | Exceptional 1.8% |
| Immigrants | Hong Kong | 100.0 /100 | #5 | Exceptional 1.8% |
| Immigrants | Taiwan | 100.0 /100 | #6 | Exceptional 1.8% |
| Cypriots | 100.0 /100 | #7 | Exceptional 1.8% |
| Immigrants | Ireland | 100.0 /100 | #8 | Exceptional 1.8% |
| Immigrants | China | 100.0 /100 | #9 | Exceptional 1.8% |
| Okinawans | 100.0 /100 | #10 | Exceptional 1.9% |
| Immigrants | Belarus | 100.0 /100 | #11 | Exceptional 1.9% |
| Immigrants | Greece | 100.0 /100 | #12 | Exceptional 1.9% |
| Immigrants | Singapore | 100.0 /100 | #13 | Exceptional 1.9% |
| Immigrants | Lithuania | 100.0 /100 | #14 | Exceptional 1.9% |
| Immigrants | Eastern Asia | 100.0 /100 | #15 | Exceptional 1.9% |
| Immigrants | Iran | 100.0 /100 | #16 | Exceptional 1.9% |
| Immigrants | India | 100.0 /100 | #17 | Exceptional 1.9% |
Demographics Similar to Barbadians by Single Father Households
In terms of single father households, the demographic groups most similar to Barbadians are Immigrants from Netherlands (2.2%, a difference of 0.040%), Slovene (2.2%, a difference of 0.060%), Italian (2.2%, a difference of 0.13%), Immigrants from Southern Europe (2.2%, a difference of 0.17%), and Immigrants from Canada (2.2%, a difference of 0.21%).
| Demographics | Rating | Rank | Single Father Households |
| Argentineans | 98.9 /100 | #102 | Exceptional 2.1% |
| Lebanese | 98.9 /100 | #103 | Exceptional 2.1% |
| Alsatians | 98.9 /100 | #104 | Exceptional 2.1% |
| Palestinians | 98.6 /100 | #105 | Exceptional 2.2% |
| Immigrants | Southern Europe | 98.6 /100 | #106 | Exceptional 2.2% |
| Slovenes | 98.5 /100 | #107 | Exceptional 2.2% |
| Immigrants | Netherlands | 98.5 /100 | #108 | Exceptional 2.2% |
| Barbadians | 98.4 /100 | #109 | Exceptional 2.2% |
| Italians | 98.3 /100 | #110 | Exceptional 2.2% |
| Immigrants | Canada | 98.3 /100 | #111 | Exceptional 2.2% |
| Immigrants | Trinidad and Tobago | 98.2 /100 | #112 | Exceptional 2.2% |
| Iraqis | 98.2 /100 | #113 | Exceptional 2.2% |
| Immigrants | North America | 98.2 /100 | #114 | Exceptional 2.2% |
| Immigrants | Barbados | 98.2 /100 | #115 | Exceptional 2.2% |
| Immigrants | Argentina | 98.1 /100 | #116 | Exceptional 2.2% |