Macedonian vs Immigrants from Peru Family Households
COMPARE
Macedonian
Immigrants from Peru
Family Households
Family Households Comparison
Macedonians
Immigrants from Peru
63.7%
FAMILY HOUSEHOLDS
6.5/ 100
METRIC RATING
219th/ 347
METRIC RANK
67.2%
FAMILY HOUSEHOLDS
100.0/ 100
METRIC RATING
30th/ 347
METRIC RANK
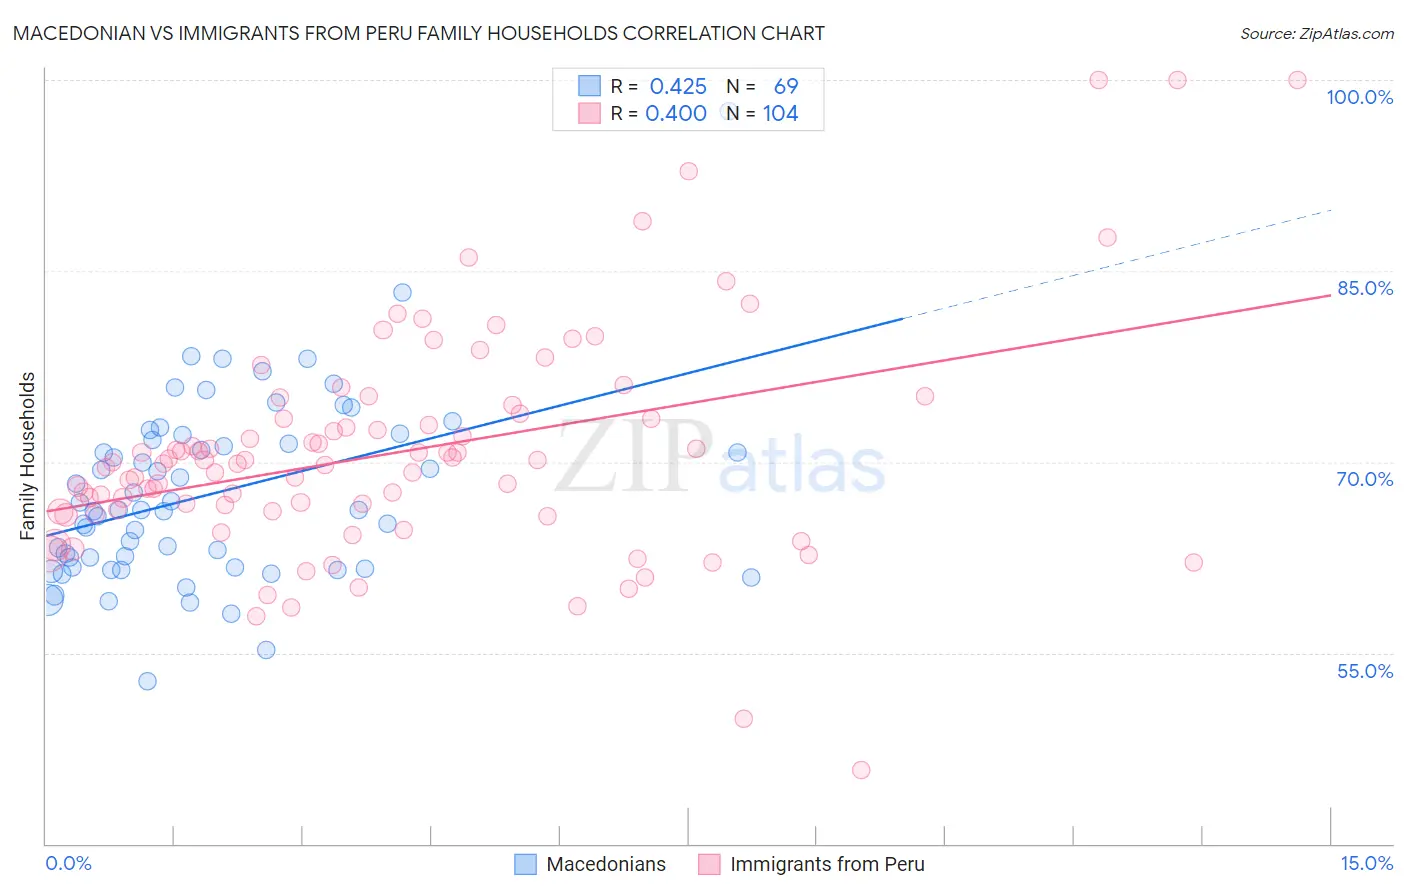
Macedonian vs Immigrants from Peru Family Households Correlation Chart
The statistical analysis conducted on geographies consisting of 132,622,141 people shows a moderate positive correlation between the proportion of Macedonians and percentage of family households in the United States with a correlation coefficient (R) of 0.425 and weighted average of 63.7%. Similarly, the statistical analysis conducted on geographies consisting of 328,761,314 people shows a mild positive correlation between the proportion of Immigrants from Peru and percentage of family households in the United States with a correlation coefficient (R) of 0.400 and weighted average of 67.2%, a difference of 5.5%.
Family Households Correlation Summary
| Measurement | Macedonian | Immigrants from Peru |
| Minimum | 52.7% | 45.8% |
| Maximum | 97.6% | 100.0% |
| Range | 44.8% | 54.2% |
| Mean | 67.5% | 70.8% |
| Median | 66.2% | 69.9% |
| Interquartile 25% (IQ1) | 61.7% | 66.1% |
| Interquartile 75% (IQ3) | 72.0% | 73.6% |
| Interquartile Range (IQR) | 10.2% | 7.5% |
| Standard Deviation (Sample) | 7.2% | 9.0% |
| Standard Deviation (Population) | 7.2% | 8.9% |
Similar Demographics by Family Households
Demographics Similar to Macedonians by Family Households
In terms of family households, the demographic groups most similar to Macedonians are Immigrants from Europe (63.7%, a difference of 0.010%), Osage (63.7%, a difference of 0.030%), Marshallese (63.7%, a difference of 0.030%), Immigrants from South Africa (63.7%, a difference of 0.030%), and Croatian (63.8%, a difference of 0.040%).
| Demographics | Rating | Rank | Family Households |
| Immigrants | Netherlands | 9.4 /100 | #212 | Tragic 63.8% |
| Immigrants | Northern Europe | 8.8 /100 | #213 | Tragic 63.8% |
| Celtics | 8.0 /100 | #214 | Tragic 63.8% |
| Belgians | 7.6 /100 | #215 | Tragic 63.8% |
| Croatians | 7.3 /100 | #216 | Tragic 63.8% |
| Osage | 7.0 /100 | #217 | Tragic 63.7% |
| Marshallese | 6.9 /100 | #218 | Tragic 63.7% |
| Macedonians | 6.5 /100 | #219 | Tragic 63.7% |
| Immigrants | Europe | 6.4 /100 | #220 | Tragic 63.7% |
| Immigrants | South Africa | 5.9 /100 | #221 | Tragic 63.7% |
| Immigrants | Belarus | 5.5 /100 | #222 | Tragic 63.7% |
| French Canadians | 5.4 /100 | #223 | Tragic 63.7% |
| Turks | 4.5 /100 | #224 | Tragic 63.6% |
| Immigrants | Hungary | 4.3 /100 | #225 | Tragic 63.6% |
| Immigrants | Bahamas | 4.2 /100 | #226 | Tragic 63.6% |
Demographics Similar to Immigrants from Peru by Family Households
In terms of family households, the demographic groups most similar to Immigrants from Peru are Immigrants from Latin America (67.2%, a difference of 0.010%), Nepalese (67.2%, a difference of 0.070%), Salvadoran (67.2%, a difference of 0.11%), Thai (67.2%, a difference of 0.12%), and Tohono O'odham (67.1%, a difference of 0.17%).
| Demographics | Rating | Rank | Family Households |
| Immigrants | Pakistan | 100.0 /100 | #23 | Exceptional 67.7% |
| Immigrants | South Eastern Asia | 100.0 /100 | #24 | Exceptional 67.5% |
| Immigrants | Nicaragua | 100.0 /100 | #25 | Exceptional 67.5% |
| Immigrants | India | 100.0 /100 | #26 | Exceptional 67.4% |
| Hispanics or Latinos | 100.0 /100 | #27 | Exceptional 67.4% |
| Hawaiians | 100.0 /100 | #28 | Exceptional 67.4% |
| Nicaraguans | 100.0 /100 | #29 | Exceptional 67.4% |
| Immigrants | Peru | 100.0 /100 | #30 | Exceptional 67.2% |
| Immigrants | Latin America | 100.0 /100 | #31 | Exceptional 67.2% |
| Nepalese | 100.0 /100 | #32 | Exceptional 67.2% |
| Salvadorans | 100.0 /100 | #33 | Exceptional 67.2% |
| Thais | 100.0 /100 | #34 | Exceptional 67.2% |
| Tohono O'odham | 100.0 /100 | #35 | Exceptional 67.1% |
| Peruvians | 100.0 /100 | #36 | Exceptional 67.1% |
| Tsimshian | 100.0 /100 | #37 | Exceptional 67.1% |