Lumbee vs Immigrants from Serbia Single Mother Households
COMPARE
Lumbee
Immigrants from Serbia
Single Mother Households
Single Mother Households Comparison
Lumbee
Immigrants from Serbia
9.1%
SINGLE MOTHER HOUSEHOLDS
0.0/ 100
METRIC RATING
340th/ 347
METRIC RANK
5.4%
SINGLE MOTHER HOUSEHOLDS
99.6/ 100
METRIC RATING
38th/ 347
METRIC RANK
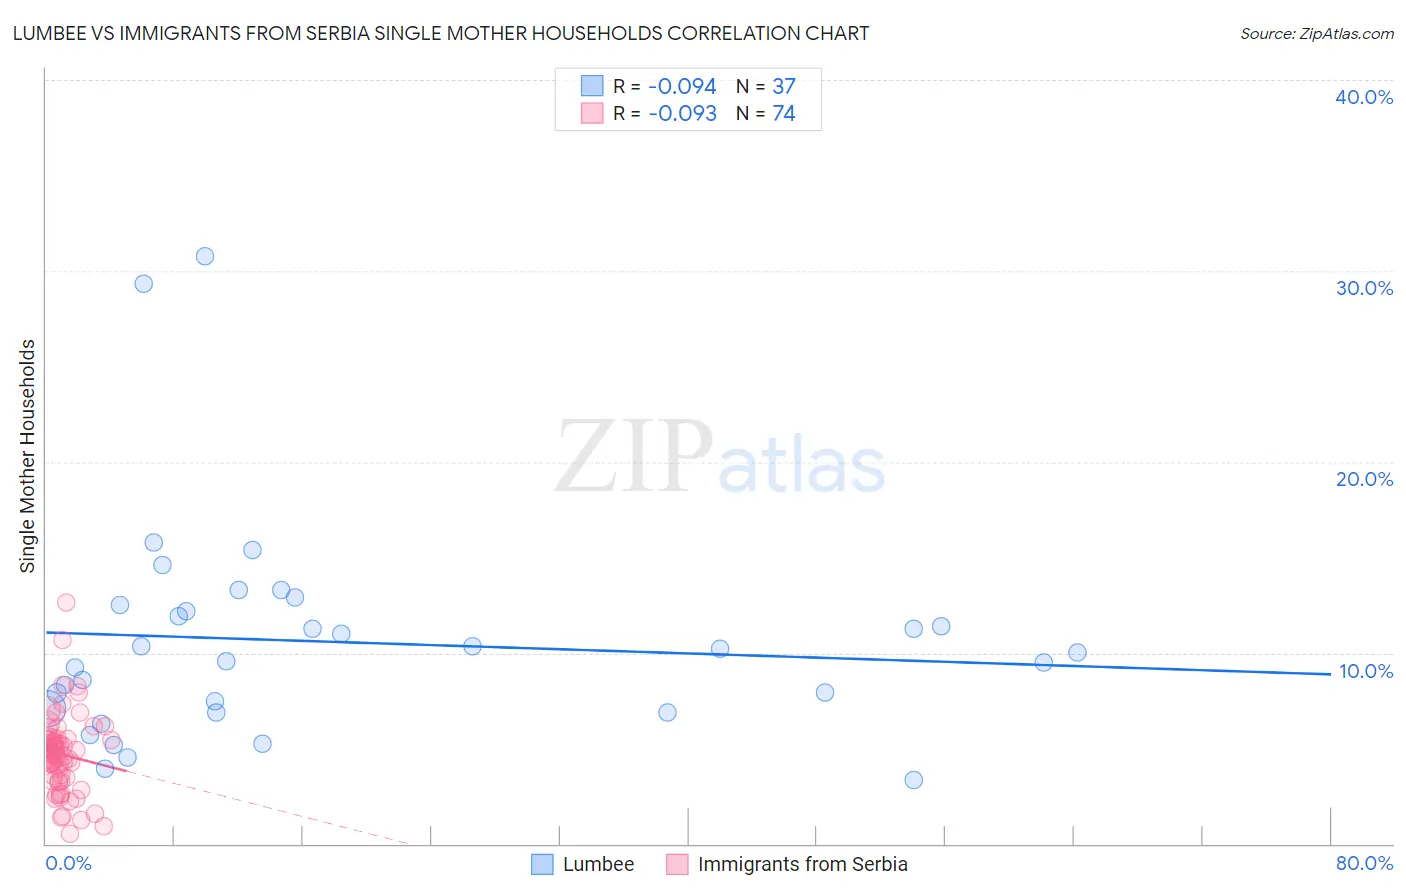
Lumbee vs Immigrants from Serbia Single Mother Households Correlation Chart
The statistical analysis conducted on geographies consisting of 92,236,041 people shows a slight negative correlation between the proportion of Lumbee and percentage of single mother households in the United States with a correlation coefficient (R) of -0.094 and weighted average of 9.1%. Similarly, the statistical analysis conducted on geographies consisting of 131,621,048 people shows a slight negative correlation between the proportion of Immigrants from Serbia and percentage of single mother households in the United States with a correlation coefficient (R) of -0.093 and weighted average of 5.4%, a difference of 70.0%.
Single Mother Households Correlation Summary
| Measurement | Lumbee | Immigrants from Serbia |
| Minimum | 3.3% | 0.54% |
| Maximum | 30.7% | 12.6% |
| Range | 27.4% | 12.1% |
| Mean | 10.6% | 4.7% |
| Median | 10.0% | 4.7% |
| Interquartile 25% (IQ1) | 7.0% | 3.5% |
| Interquartile 75% (IQ3) | 12.3% | 5.4% |
| Interquartile Range (IQR) | 5.3% | 2.0% |
| Standard Deviation (Sample) | 5.7% | 2.0% |
| Standard Deviation (Population) | 5.6% | 2.0% |
Similar Demographics by Single Mother Households
Demographics Similar to Lumbee by Single Mother Households
In terms of single mother households, the demographic groups most similar to Lumbee are Tohono O'odham (9.1%, a difference of 0.36%), Menominee (9.2%, a difference of 0.68%), Dominican (9.2%, a difference of 0.89%), Black/African American (9.0%, a difference of 1.2%), and Cape Verdean (8.9%, a difference of 2.8%).
| Demographics | Rating | Rank | Single Mother Households |
| Liberians | 0.0 /100 | #333 | Tragic 8.6% |
| Immigrants | Liberia | 0.0 /100 | #334 | Tragic 8.7% |
| Immigrants | Dominica | 0.0 /100 | #335 | Tragic 8.7% |
| Puerto Ricans | 0.0 /100 | #336 | Tragic 8.7% |
| Navajo | 0.0 /100 | #337 | Tragic 8.8% |
| Cape Verdeans | 0.0 /100 | #338 | Tragic 8.9% |
| Blacks/African Americans | 0.0 /100 | #339 | Tragic 9.0% |
| Lumbee | 0.0 /100 | #340 | Tragic 9.1% |
| Tohono O'odham | 0.0 /100 | #341 | Tragic 9.1% |
| Menominee | 0.0 /100 | #342 | Tragic 9.2% |
| Dominicans | 0.0 /100 | #343 | Tragic 9.2% |
| Immigrants | Dominican Republic | 0.0 /100 | #344 | Tragic 9.5% |
| Immigrants | Cabo Verde | 0.0 /100 | #345 | Tragic 9.6% |
| Yuman | 0.0 /100 | #346 | Tragic 9.6% |
| Yup'ik | 0.0 /100 | #347 | Tragic 10.0% |
Demographics Similar to Immigrants from Serbia by Single Mother Households
In terms of single mother households, the demographic groups most similar to Immigrants from Serbia are Immigrants from Sweden (5.4%, a difference of 0.14%), Estonian (5.4%, a difference of 0.25%), Immigrants from Belgium (5.3%, a difference of 0.43%), Immigrants from Czechoslovakia (5.3%, a difference of 0.58%), and Immigrants from Greece (5.4%, a difference of 0.67%).
| Demographics | Rating | Rank | Single Mother Households |
| Immigrants | Korea | 99.7 /100 | #31 | Exceptional 5.3% |
| Cambodians | 99.7 /100 | #32 | Exceptional 5.3% |
| Immigrants | Switzerland | 99.7 /100 | #33 | Exceptional 5.3% |
| Bulgarians | 99.7 /100 | #34 | Exceptional 5.3% |
| Immigrants | Northern Europe | 99.7 /100 | #35 | Exceptional 5.3% |
| Immigrants | Czechoslovakia | 99.7 /100 | #36 | Exceptional 5.3% |
| Immigrants | Belgium | 99.7 /100 | #37 | Exceptional 5.3% |
| Immigrants | Serbia | 99.6 /100 | #38 | Exceptional 5.4% |
| Immigrants | Sweden | 99.6 /100 | #39 | Exceptional 5.4% |
| Estonians | 99.6 /100 | #40 | Exceptional 5.4% |
| Immigrants | Greece | 99.5 /100 | #41 | Exceptional 5.4% |
| Macedonians | 99.5 /100 | #42 | Exceptional 5.4% |
| Immigrants | South Central Asia | 99.5 /100 | #43 | Exceptional 5.4% |
| Lithuanians | 99.4 /100 | #44 | Exceptional 5.4% |
| Immigrants | Croatia | 99.4 /100 | #45 | Exceptional 5.4% |