Italian vs Immigrants from Bulgaria Family Households with Children
COMPARE
Italian
Immigrants from Bulgaria
Family Households with Children
Family Households with Children Comparison
Italians
Immigrants from Bulgaria
26.8%
FAMILY HOUSEHOLDS WITH CHILDREN
1.5/ 100
METRIC RATING
253rd/ 347
METRIC RANK
26.9%
FAMILY HOUSEHOLDS WITH CHILDREN
3.3/ 100
METRIC RATING
240th/ 347
METRIC RANK
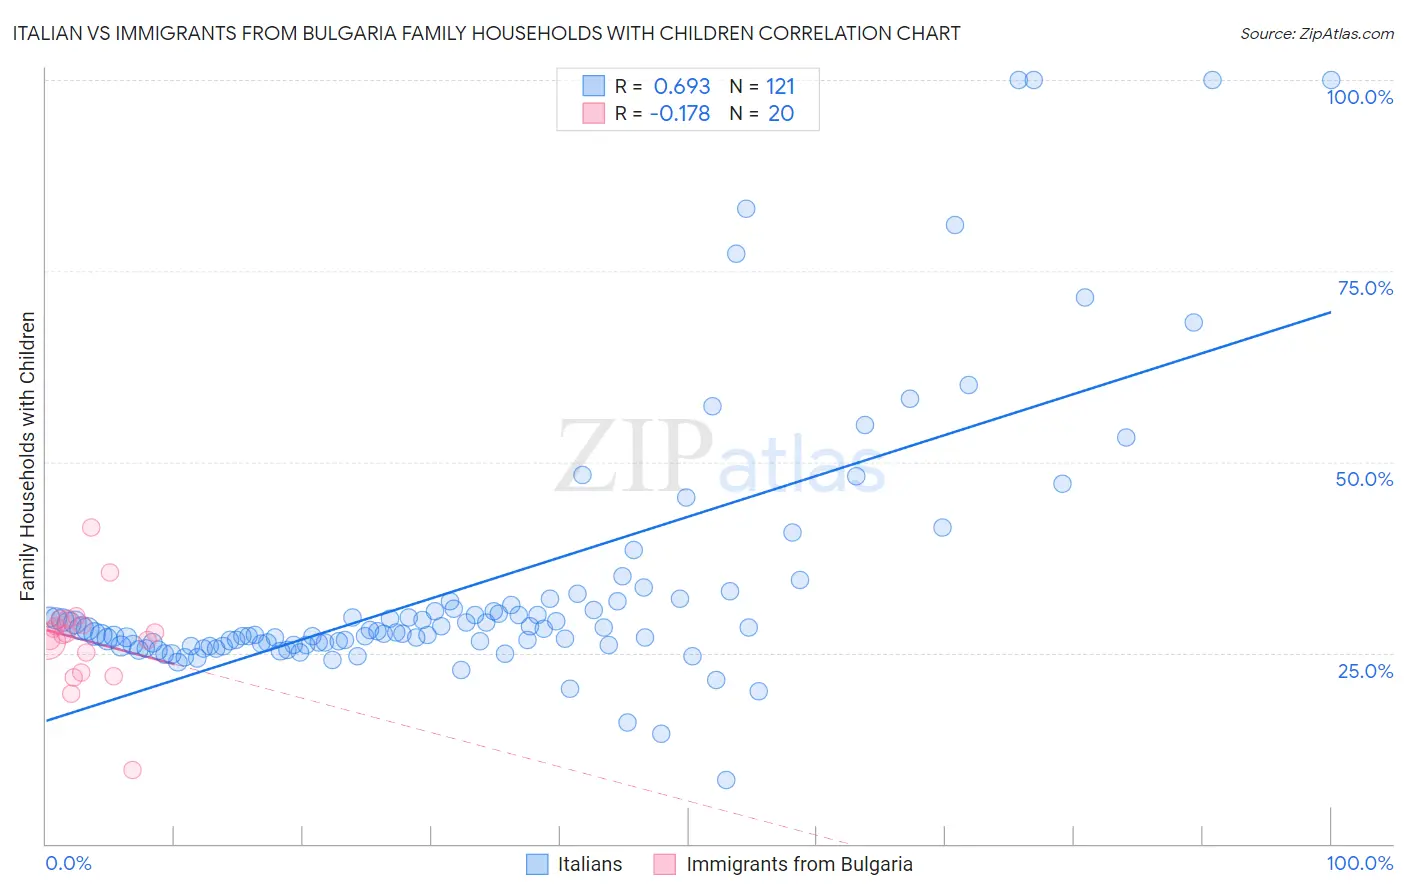
Italian vs Immigrants from Bulgaria Family Households with Children Correlation Chart
The statistical analysis conducted on geographies consisting of 573,982,396 people shows a significant positive correlation between the proportion of Italians and percentage of family households with children in the United States with a correlation coefficient (R) of 0.693 and weighted average of 26.8%. Similarly, the statistical analysis conducted on geographies consisting of 172,500,518 people shows a poor negative correlation between the proportion of Immigrants from Bulgaria and percentage of family households with children in the United States with a correlation coefficient (R) of -0.178 and weighted average of 26.9%, a difference of 0.43%.
Family Households with Children Correlation Summary
| Measurement | Italian | Immigrants from Bulgaria |
| Minimum | 8.3% | 9.6% |
| Maximum | 100.0% | 41.4% |
| Range | 91.7% | 31.7% |
| Mean | 33.8% | 26.7% |
| Median | 27.7% | 27.4% |
| Interquartile 25% (IQ1) | 26.0% | 23.7% |
| Interquartile 75% (IQ3) | 31.4% | 29.0% |
| Interquartile Range (IQR) | 5.4% | 5.3% |
| Standard Deviation (Sample) | 17.3% | 6.2% |
| Standard Deviation (Population) | 17.3% | 6.1% |
Demographics Similar to Italians and Immigrants from Bulgaria by Family Households with Children
In terms of family households with children, the demographic groups most similar to Italians are Immigrants from Scotland (26.8%, a difference of 0.030%), German Russian (26.8%, a difference of 0.030%), Scotch-Irish (26.8%, a difference of 0.050%), Irish (26.8%, a difference of 0.080%), and Immigrants from Bosnia and Herzegovina (26.8%, a difference of 0.11%). Similarly, the demographic groups most similar to Immigrants from Bulgaria are Navajo (26.9%, a difference of 0.010%), Immigrants from England (26.9%, a difference of 0.010%), Moroccan (26.9%, a difference of 0.020%), Immigrants from Southern Europe (26.9%, a difference of 0.020%), and Immigrants from Netherlands (26.9%, a difference of 0.030%).
| Demographics | Rating | Rank | Family Households with Children |
| Cape Verdeans | 3.6 /100 | #236 | Tragic 26.9% |
| Immigrants | Netherlands | 3.5 /100 | #237 | Tragic 26.9% |
| Moroccans | 3.4 /100 | #238 | Tragic 26.9% |
| Immigrants | Southern Europe | 3.4 /100 | #239 | Tragic 26.9% |
| Immigrants | Bulgaria | 3.3 /100 | #240 | Tragic 26.9% |
| Navajo | 3.2 /100 | #241 | Tragic 26.9% |
| Immigrants | England | 3.2 /100 | #242 | Tragic 26.9% |
| Immigrants | Saudi Arabia | 2.9 /100 | #243 | Tragic 26.9% |
| Ukrainians | 2.9 /100 | #244 | Tragic 26.9% |
| Australians | 2.8 /100 | #245 | Tragic 26.9% |
| Jamaicans | 2.5 /100 | #246 | Tragic 26.9% |
| Potawatomi | 2.2 /100 | #247 | Tragic 26.9% |
| Immigrants | Kazakhstan | 2.2 /100 | #248 | Tragic 26.9% |
| Immigrants | Eastern Europe | 2.1 /100 | #249 | Tragic 26.9% |
| Belgians | 2.1 /100 | #250 | Tragic 26.9% |
| Immigrants | Bosnia and Herzegovina | 1.9 /100 | #251 | Tragic 26.8% |
| Irish | 1.8 /100 | #252 | Tragic 26.8% |
| Italians | 1.5 /100 | #253 | Tragic 26.8% |
| Immigrants | Scotland | 1.5 /100 | #254 | Tragic 26.8% |
| German Russians | 1.5 /100 | #255 | Tragic 26.8% |
| Scotch-Irish | 1.4 /100 | #256 | Tragic 26.8% |