Immigrants from Western Asia vs Immigrants from Syria Births to Unmarried Women
COMPARE
Immigrants from Western Asia
Immigrants from Syria
Births to Unmarried Women
Births to Unmarried Women Comparison
Immigrants from Western Asia
Immigrants from Syria
27.2%
BIRTHS TO UNMARRIED WOMEN
99.7/ 100
METRIC RATING
36th/ 347
METRIC RANK
29.4%
BIRTHS TO UNMARRIED WOMEN
95.7/ 100
METRIC RATING
98th/ 347
METRIC RANK
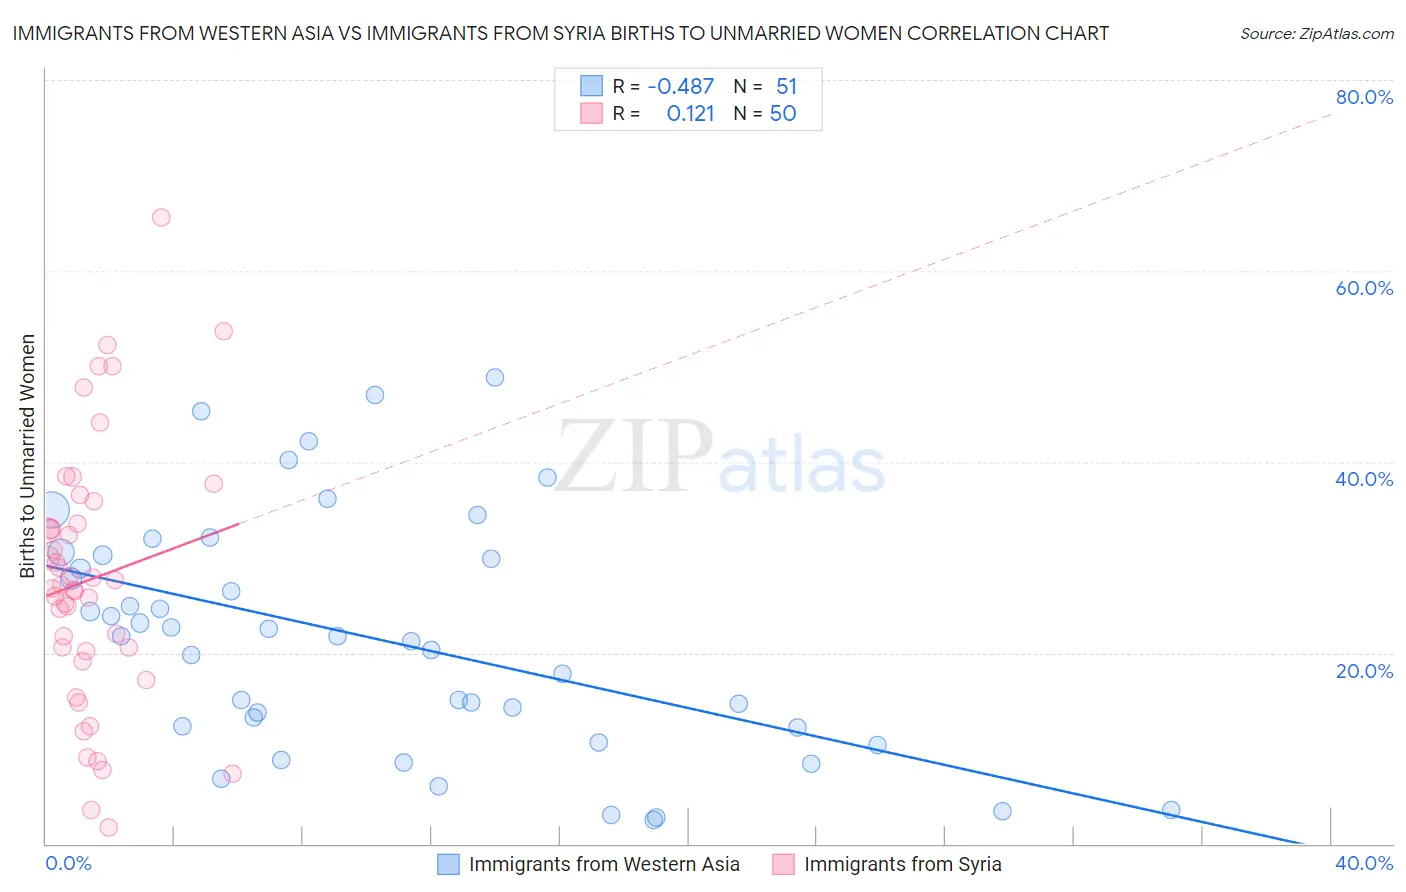
Immigrants from Western Asia vs Immigrants from Syria Births to Unmarried Women Correlation Chart
The statistical analysis conducted on geographies consisting of 375,849,187 people shows a moderate negative correlation between the proportion of Immigrants from Western Asia and percentage of births to unmarried women in the United States with a correlation coefficient (R) of -0.487 and weighted average of 27.2%. Similarly, the statistical analysis conducted on geographies consisting of 168,026,098 people shows a poor positive correlation between the proportion of Immigrants from Syria and percentage of births to unmarried women in the United States with a correlation coefficient (R) of 0.121 and weighted average of 29.4%, a difference of 7.9%.
Births to Unmarried Women Correlation Summary
| Measurement | Immigrants from Western Asia | Immigrants from Syria |
| Minimum | 2.5% | 1.7% |
| Maximum | 48.9% | 65.6% |
| Range | 46.4% | 63.9% |
| Mean | 21.4% | 27.7% |
| Median | 21.7% | 26.9% |
| Interquartile 25% (IQ1) | 12.1% | 20.2% |
| Interquartile 75% (IQ3) | 30.2% | 33.5% |
| Interquartile Range (IQR) | 18.1% | 13.4% |
| Standard Deviation (Sample) | 12.4% | 13.6% |
| Standard Deviation (Population) | 12.2% | 13.5% |
Similar Demographics by Births to Unmarried Women
Demographics Similar to Immigrants from Western Asia by Births to Unmarried Women
In terms of births to unmarried women, the demographic groups most similar to Immigrants from Western Asia are Immigrants from Ireland (27.2%, a difference of 0.070%), Immigrants from Ukraine (27.2%, a difference of 0.090%), Immigrants from Pakistan (27.2%, a difference of 0.15%), Immigrants from Sri Lanka (27.2%, a difference of 0.19%), and Immigrants from Moldova (27.3%, a difference of 0.23%).
| Demographics | Rating | Rank | Births to Unmarried Women |
| Cypriots | 99.8 /100 | #29 | Exceptional 27.0% |
| Bulgarians | 99.8 /100 | #30 | Exceptional 27.1% |
| Immigrants | Iraq | 99.8 /100 | #31 | Exceptional 27.1% |
| Immigrants | Russia | 99.8 /100 | #32 | Exceptional 27.1% |
| Immigrants | Sri Lanka | 99.8 /100 | #33 | Exceptional 27.2% |
| Immigrants | Pakistan | 99.8 /100 | #34 | Exceptional 27.2% |
| Immigrants | Ireland | 99.7 /100 | #35 | Exceptional 27.2% |
| Immigrants | Western Asia | 99.7 /100 | #36 | Exceptional 27.2% |
| Immigrants | Ukraine | 99.7 /100 | #37 | Exceptional 27.2% |
| Immigrants | Moldova | 99.7 /100 | #38 | Exceptional 27.3% |
| Immigrants | Malaysia | 99.7 /100 | #39 | Exceptional 27.4% |
| Turks | 99.6 /100 | #40 | Exceptional 27.4% |
| Iraqis | 99.6 /100 | #41 | Exceptional 27.6% |
| Immigrants | Eastern Europe | 99.6 /100 | #42 | Exceptional 27.6% |
| Immigrants | Bulgaria | 99.6 /100 | #43 | Exceptional 27.6% |
Demographics Similar to Immigrants from Syria by Births to Unmarried Women
In terms of births to unmarried women, the demographic groups most similar to Immigrants from Syria are Immigrants from South Africa (29.3%, a difference of 0.020%), Norwegian (29.3%, a difference of 0.070%), Immigrants from Denmark (29.4%, a difference of 0.24%), Luxembourger (29.4%, a difference of 0.24%), and Immigrants from Vietnam (29.3%, a difference of 0.30%).
| Demographics | Rating | Rank | Births to Unmarried Women |
| Immigrants | Fiji | 96.6 /100 | #91 | Exceptional 29.2% |
| Arabs | 96.5 /100 | #92 | Exceptional 29.2% |
| Estonians | 96.5 /100 | #93 | Exceptional 29.2% |
| Ukrainians | 96.3 /100 | #94 | Exceptional 29.2% |
| Immigrants | Vietnam | 96.1 /100 | #95 | Exceptional 29.3% |
| Norwegians | 95.8 /100 | #96 | Exceptional 29.3% |
| Immigrants | South Africa | 95.7 /100 | #97 | Exceptional 29.3% |
| Immigrants | Syria | 95.7 /100 | #98 | Exceptional 29.4% |
| Immigrants | Denmark | 95.3 /100 | #99 | Exceptional 29.4% |
| Luxembourgers | 95.2 /100 | #100 | Exceptional 29.4% |
| Immigrants | Northern Africa | 94.7 /100 | #101 | Exceptional 29.5% |
| Australians | 94.6 /100 | #102 | Exceptional 29.5% |
| Lebanese | 94.4 /100 | #103 | Exceptional 29.5% |
| Lithuanians | 94.4 /100 | #104 | Exceptional 29.6% |
| Immigrants | Nepal | 94.3 /100 | #105 | Exceptional 29.6% |