Immigrants from Western Asia vs Immigrants from Italy Births to Unmarried Women
COMPARE
Immigrants from Western Asia
Immigrants from Italy
Births to Unmarried Women
Births to Unmarried Women Comparison
Immigrants from Western Asia
Immigrants from Italy
27.2%
BIRTHS TO UNMARRIED WOMEN
99.7/ 100
METRIC RATING
36th/ 347
METRIC RANK
29.9%
BIRTHS TO UNMARRIED WOMEN
91.7/ 100
METRIC RATING
116th/ 347
METRIC RANK
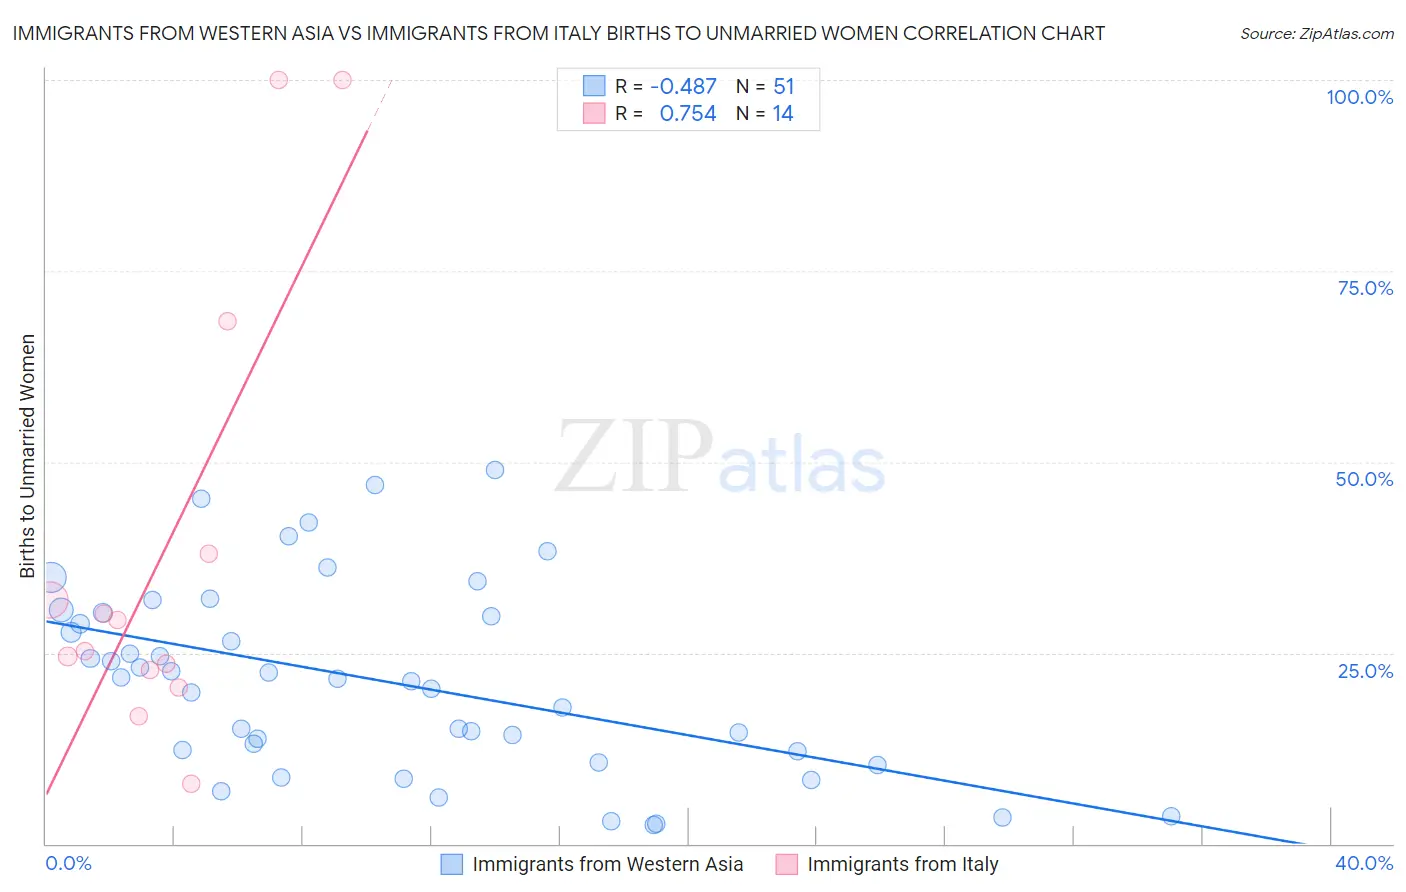
Immigrants from Western Asia vs Immigrants from Italy Births to Unmarried Women Correlation Chart
The statistical analysis conducted on geographies consisting of 375,849,187 people shows a moderate negative correlation between the proportion of Immigrants from Western Asia and percentage of births to unmarried women in the United States with a correlation coefficient (R) of -0.487 and weighted average of 27.2%. Similarly, the statistical analysis conducted on geographies consisting of 300,581,400 people shows a strong positive correlation between the proportion of Immigrants from Italy and percentage of births to unmarried women in the United States with a correlation coefficient (R) of 0.754 and weighted average of 29.9%, a difference of 9.8%.
Births to Unmarried Women Correlation Summary
| Measurement | Immigrants from Western Asia | Immigrants from Italy |
| Minimum | 2.5% | 7.9% |
| Maximum | 48.9% | 100.0% |
| Range | 46.4% | 92.1% |
| Mean | 21.4% | 38.5% |
| Median | 21.7% | 27.2% |
| Interquartile 25% (IQ1) | 12.1% | 22.8% |
| Interquartile 75% (IQ3) | 30.2% | 38.0% |
| Interquartile Range (IQR) | 18.1% | 15.2% |
| Standard Deviation (Sample) | 12.4% | 29.4% |
| Standard Deviation (Population) | 12.2% | 28.3% |
Similar Demographics by Births to Unmarried Women
Demographics Similar to Immigrants from Western Asia by Births to Unmarried Women
In terms of births to unmarried women, the demographic groups most similar to Immigrants from Western Asia are Immigrants from Ireland (27.2%, a difference of 0.070%), Immigrants from Ukraine (27.2%, a difference of 0.090%), Immigrants from Pakistan (27.2%, a difference of 0.15%), Immigrants from Sri Lanka (27.2%, a difference of 0.19%), and Immigrants from Moldova (27.3%, a difference of 0.23%).
| Demographics | Rating | Rank | Births to Unmarried Women |
| Cypriots | 99.8 /100 | #29 | Exceptional 27.0% |
| Bulgarians | 99.8 /100 | #30 | Exceptional 27.1% |
| Immigrants | Iraq | 99.8 /100 | #31 | Exceptional 27.1% |
| Immigrants | Russia | 99.8 /100 | #32 | Exceptional 27.1% |
| Immigrants | Sri Lanka | 99.8 /100 | #33 | Exceptional 27.2% |
| Immigrants | Pakistan | 99.8 /100 | #34 | Exceptional 27.2% |
| Immigrants | Ireland | 99.7 /100 | #35 | Exceptional 27.2% |
| Immigrants | Western Asia | 99.7 /100 | #36 | Exceptional 27.2% |
| Immigrants | Ukraine | 99.7 /100 | #37 | Exceptional 27.2% |
| Immigrants | Moldova | 99.7 /100 | #38 | Exceptional 27.3% |
| Immigrants | Malaysia | 99.7 /100 | #39 | Exceptional 27.4% |
| Turks | 99.6 /100 | #40 | Exceptional 27.4% |
| Iraqis | 99.6 /100 | #41 | Exceptional 27.6% |
| Immigrants | Eastern Europe | 99.6 /100 | #42 | Exceptional 27.6% |
| Immigrants | Bulgaria | 99.6 /100 | #43 | Exceptional 27.6% |
Demographics Similar to Immigrants from Italy by Births to Unmarried Women
In terms of births to unmarried women, the demographic groups most similar to Immigrants from Italy are Ethiopian (29.8%, a difference of 0.080%), Immigrants from Netherlands (29.9%, a difference of 0.21%), Immigrants from Norway (29.9%, a difference of 0.23%), Immigrants from Croatia (29.8%, a difference of 0.30%), and Scandinavian (29.8%, a difference of 0.36%).
| Demographics | Rating | Rank | Births to Unmarried Women |
| Greeks | 93.4 /100 | #109 | Exceptional 29.7% |
| Immigrants | Ethiopia | 93.4 /100 | #110 | Exceptional 29.7% |
| Immigrants | Hungary | 93.0 /100 | #111 | Exceptional 29.7% |
| Basques | 93.0 /100 | #112 | Exceptional 29.7% |
| Scandinavians | 92.7 /100 | #113 | Exceptional 29.8% |
| Immigrants | Croatia | 92.6 /100 | #114 | Exceptional 29.8% |
| Ethiopians | 91.9 /100 | #115 | Exceptional 29.8% |
| Immigrants | Italy | 91.7 /100 | #116 | Exceptional 29.9% |
| Immigrants | Netherlands | 91.1 /100 | #117 | Exceptional 29.9% |
| Immigrants | Norway | 91.0 /100 | #118 | Exceptional 29.9% |
| Argentineans | 90.5 /100 | #119 | Exceptional 30.0% |
| Ugandans | 89.2 /100 | #120 | Excellent 30.1% |
| Koreans | 88.9 /100 | #121 | Excellent 30.1% |
| Immigrants | Argentina | 88.7 /100 | #122 | Excellent 30.1% |
| Syrians | 88.2 /100 | #123 | Excellent 30.2% |