Immigrants from Western Asia vs Immigrants from Germany Births to Unmarried Women
COMPARE
Immigrants from Western Asia
Immigrants from Germany
Births to Unmarried Women
Births to Unmarried Women Comparison
Immigrants from Western Asia
Immigrants from Germany
27.2%
BIRTHS TO UNMARRIED WOMEN
99.7/ 100
METRIC RATING
36th/ 347
METRIC RANK
32.8%
BIRTHS TO UNMARRIED WOMEN
18.8/ 100
METRIC RATING
200th/ 347
METRIC RANK
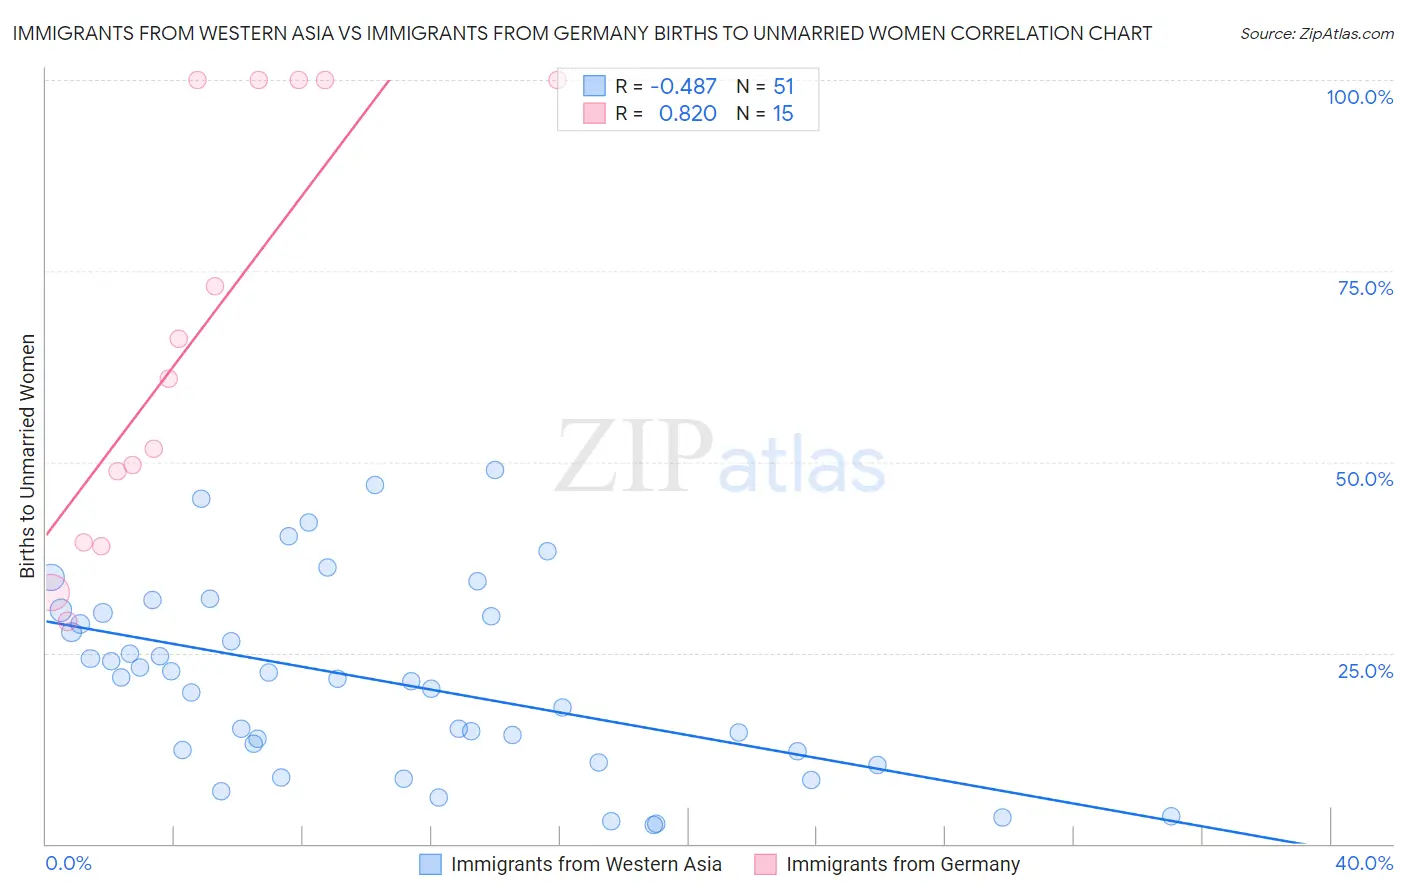
Immigrants from Western Asia vs Immigrants from Germany Births to Unmarried Women Correlation Chart
The statistical analysis conducted on geographies consisting of 375,849,187 people shows a moderate negative correlation between the proportion of Immigrants from Western Asia and percentage of births to unmarried women in the United States with a correlation coefficient (R) of -0.487 and weighted average of 27.2%. Similarly, the statistical analysis conducted on geographies consisting of 426,659,572 people shows a very strong positive correlation between the proportion of Immigrants from Germany and percentage of births to unmarried women in the United States with a correlation coefficient (R) of 0.820 and weighted average of 32.8%, a difference of 20.4%.
Births to Unmarried Women Correlation Summary
| Measurement | Immigrants from Western Asia | Immigrants from Germany |
| Minimum | 2.5% | 29.1% |
| Maximum | 48.9% | 100.0% |
| Range | 46.4% | 70.9% |
| Mean | 21.4% | 66.0% |
| Median | 21.7% | 60.8% |
| Interquartile 25% (IQ1) | 12.1% | 39.5% |
| Interquartile 75% (IQ3) | 30.2% | 100.0% |
| Interquartile Range (IQR) | 18.1% | 60.5% |
| Standard Deviation (Sample) | 12.4% | 27.4% |
| Standard Deviation (Population) | 12.2% | 26.5% |
Similar Demographics by Births to Unmarried Women
Demographics Similar to Immigrants from Western Asia by Births to Unmarried Women
In terms of births to unmarried women, the demographic groups most similar to Immigrants from Western Asia are Immigrants from Ireland (27.2%, a difference of 0.070%), Immigrants from Ukraine (27.2%, a difference of 0.090%), Immigrants from Pakistan (27.2%, a difference of 0.15%), Immigrants from Sri Lanka (27.2%, a difference of 0.19%), and Immigrants from Moldova (27.3%, a difference of 0.23%).
| Demographics | Rating | Rank | Births to Unmarried Women |
| Cypriots | 99.8 /100 | #29 | Exceptional 27.0% |
| Bulgarians | 99.8 /100 | #30 | Exceptional 27.1% |
| Immigrants | Iraq | 99.8 /100 | #31 | Exceptional 27.1% |
| Immigrants | Russia | 99.8 /100 | #32 | Exceptional 27.1% |
| Immigrants | Sri Lanka | 99.8 /100 | #33 | Exceptional 27.2% |
| Immigrants | Pakistan | 99.8 /100 | #34 | Exceptional 27.2% |
| Immigrants | Ireland | 99.7 /100 | #35 | Exceptional 27.2% |
| Immigrants | Western Asia | 99.7 /100 | #36 | Exceptional 27.2% |
| Immigrants | Ukraine | 99.7 /100 | #37 | Exceptional 27.2% |
| Immigrants | Moldova | 99.7 /100 | #38 | Exceptional 27.3% |
| Immigrants | Malaysia | 99.7 /100 | #39 | Exceptional 27.4% |
| Turks | 99.6 /100 | #40 | Exceptional 27.4% |
| Iraqis | 99.6 /100 | #41 | Exceptional 27.6% |
| Immigrants | Eastern Europe | 99.6 /100 | #42 | Exceptional 27.6% |
| Immigrants | Bulgaria | 99.6 /100 | #43 | Exceptional 27.6% |
Demographics Similar to Immigrants from Germany by Births to Unmarried Women
In terms of births to unmarried women, the demographic groups most similar to Immigrants from Germany are Immigrants from Thailand (32.8%, a difference of 0.010%), Costa Rican (32.7%, a difference of 0.22%), Immigrants (32.7%, a difference of 0.26%), Immigrants from Burma/Myanmar (32.9%, a difference of 0.33%), and Immigrants from Micronesia (32.9%, a difference of 0.34%).
| Demographics | Rating | Rank | Births to Unmarried Women |
| Fijians | 31.1 /100 | #193 | Fair 32.3% |
| Sudanese | 27.3 /100 | #194 | Fair 32.4% |
| Samoans | 21.9 /100 | #195 | Fair 32.6% |
| Immigrants | Colombia | 21.7 /100 | #196 | Fair 32.6% |
| Immigrants | Immigrants | 20.6 /100 | #197 | Fair 32.7% |
| Costa Ricans | 20.3 /100 | #198 | Fair 32.7% |
| Immigrants | Thailand | 18.9 /100 | #199 | Poor 32.8% |
| Immigrants | Germany | 18.8 /100 | #200 | Poor 32.8% |
| Immigrants | Burma/Myanmar | 16.7 /100 | #201 | Poor 32.9% |
| Immigrants | Micronesia | 16.6 /100 | #202 | Poor 32.9% |
| Ute | 14.4 /100 | #203 | Poor 33.0% |
| Immigrants | Africa | 14.3 /100 | #204 | Poor 33.0% |
| German Russians | 13.1 /100 | #205 | Poor 33.1% |
| Uruguayans | 12.8 /100 | #206 | Poor 33.1% |
| Immigrants | Sudan | 11.5 /100 | #207 | Poor 33.2% |