Immigrants from Vietnam vs Cypriot Married-couple Households
COMPARE
Immigrants from Vietnam
Cypriot
Married-couple Households
Married-couple Households Comparison
Immigrants from Vietnam
Cypriots
48.8%
MARRIED-COUPLE HOUSEHOLDS
99.6/ 100
METRIC RATING
42nd/ 347
METRIC RANK
48.0%
MARRIED-COUPLE HOUSEHOLDS
97.2/ 100
METRIC RATING
89th/ 347
METRIC RANK
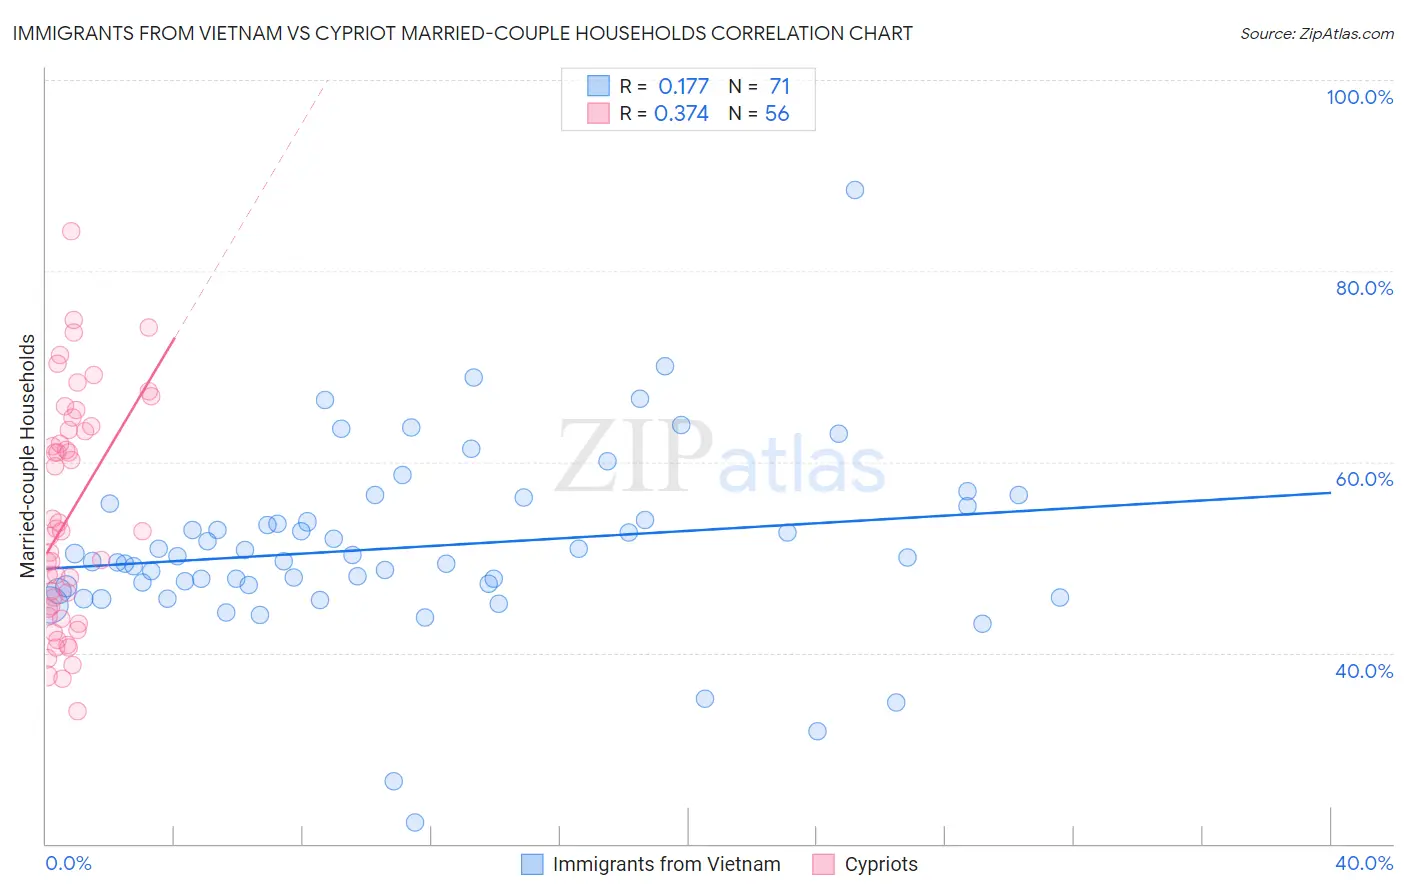
Immigrants from Vietnam vs Cypriot Married-couple Households Correlation Chart
The statistical analysis conducted on geographies consisting of 404,551,130 people shows a poor positive correlation between the proportion of Immigrants from Vietnam and percentage of married-couple family households in the United States with a correlation coefficient (R) of 0.177 and weighted average of 48.8%. Similarly, the statistical analysis conducted on geographies consisting of 61,857,015 people shows a mild positive correlation between the proportion of Cypriots and percentage of married-couple family households in the United States with a correlation coefficient (R) of 0.374 and weighted average of 48.0%, a difference of 1.7%.
Married-couple Households Correlation Summary
| Measurement | Immigrants from Vietnam | Cypriot |
| Minimum | 22.2% | 33.8% |
| Maximum | 88.5% | 84.2% |
| Range | 66.2% | 50.4% |
| Mean | 51.1% | 54.4% |
| Median | 49.9% | 52.8% |
| Interquartile 25% (IQ1) | 47.0% | 44.2% |
| Interquartile 75% (IQ3) | 55.3% | 63.6% |
| Interquartile Range (IQR) | 8.3% | 19.3% |
| Standard Deviation (Sample) | 9.7% | 11.9% |
| Standard Deviation (Population) | 9.6% | 11.8% |
Similar Demographics by Married-couple Households
Demographics Similar to Immigrants from Vietnam by Married-couple Households
In terms of married-couple households, the demographic groups most similar to Immigrants from Vietnam are Immigrants from Lebanon (48.9%, a difference of 0.050%), Immigrants from Iran (48.8%, a difference of 0.060%), Immigrants from Bolivia (48.9%, a difference of 0.080%), Lithuanian (48.9%, a difference of 0.090%), and Welsh (48.8%, a difference of 0.10%).
| Demographics | Rating | Rank | Married-couple Households |
| Scottish | 99.7 /100 | #35 | Exceptional 49.0% |
| Iranians | 99.7 /100 | #36 | Exceptional 49.0% |
| Sri Lankans | 99.7 /100 | #37 | Exceptional 49.0% |
| Greeks | 99.7 /100 | #38 | Exceptional 48.9% |
| Lithuanians | 99.6 /100 | #39 | Exceptional 48.9% |
| Immigrants | Bolivia | 99.6 /100 | #40 | Exceptional 48.9% |
| Immigrants | Lebanon | 99.6 /100 | #41 | Exceptional 48.9% |
| Immigrants | Vietnam | 99.6 /100 | #42 | Exceptional 48.8% |
| Immigrants | Iran | 99.6 /100 | #43 | Exceptional 48.8% |
| Welsh | 99.5 /100 | #44 | Exceptional 48.8% |
| Immigrants | Eastern Asia | 99.5 /100 | #45 | Exceptional 48.8% |
| Tsimshian | 99.5 /100 | #46 | Exceptional 48.7% |
| British | 99.5 /100 | #47 | Exceptional 48.7% |
| Indians (Asian) | 99.4 /100 | #48 | Exceptional 48.7% |
| Immigrants | Sri Lanka | 99.4 /100 | #49 | Exceptional 48.7% |
Demographics Similar to Cypriots by Married-couple Households
In terms of married-couple households, the demographic groups most similar to Cypriots are French (48.0%, a difference of 0.010%), Immigrants from Ireland (48.0%, a difference of 0.030%), Afghan (48.0%, a difference of 0.030%), Belgian (48.0%, a difference of 0.050%), and Immigrants from Israel (48.0%, a difference of 0.070%).
| Demographics | Rating | Rank | Married-couple Households |
| Immigrants | Poland | 97.7 /100 | #82 | Exceptional 48.1% |
| Guamanians/Chamorros | 97.6 /100 | #83 | Exceptional 48.1% |
| Ukrainians | 97.6 /100 | #84 | Exceptional 48.1% |
| Immigrants | Israel | 97.4 /100 | #85 | Exceptional 48.0% |
| Belgians | 97.4 /100 | #86 | Exceptional 48.0% |
| Immigrants | Ireland | 97.3 /100 | #87 | Exceptional 48.0% |
| Afghans | 97.3 /100 | #88 | Exceptional 48.0% |
| Cypriots | 97.2 /100 | #89 | Exceptional 48.0% |
| French | 97.2 /100 | #90 | Exceptional 48.0% |
| Immigrants | Moldova | 97.0 /100 | #91 | Exceptional 48.0% |
| Palestinians | 96.9 /100 | #92 | Exceptional 48.0% |
| Lebanese | 96.9 /100 | #93 | Exceptional 47.9% |
| Americans | 96.9 /100 | #94 | Exceptional 47.9% |
| Immigrants | Belgium | 96.8 /100 | #95 | Exceptional 47.9% |
| Immigrants | Egypt | 96.6 /100 | #96 | Exceptional 47.9% |