Immigrants from Vietnam vs Cheyenne Family Households
COMPARE
Immigrants from Vietnam
Cheyenne
Family Households
Family Households Comparison
Immigrants from Vietnam
Cheyenne
68.2%
FAMILY HOUSEHOLDS
100.0/ 100
METRIC RATING
16th/ 347
METRIC RANK
63.2%
FAMILY HOUSEHOLDS
0.5/ 100
METRIC RATING
263rd/ 347
METRIC RANK
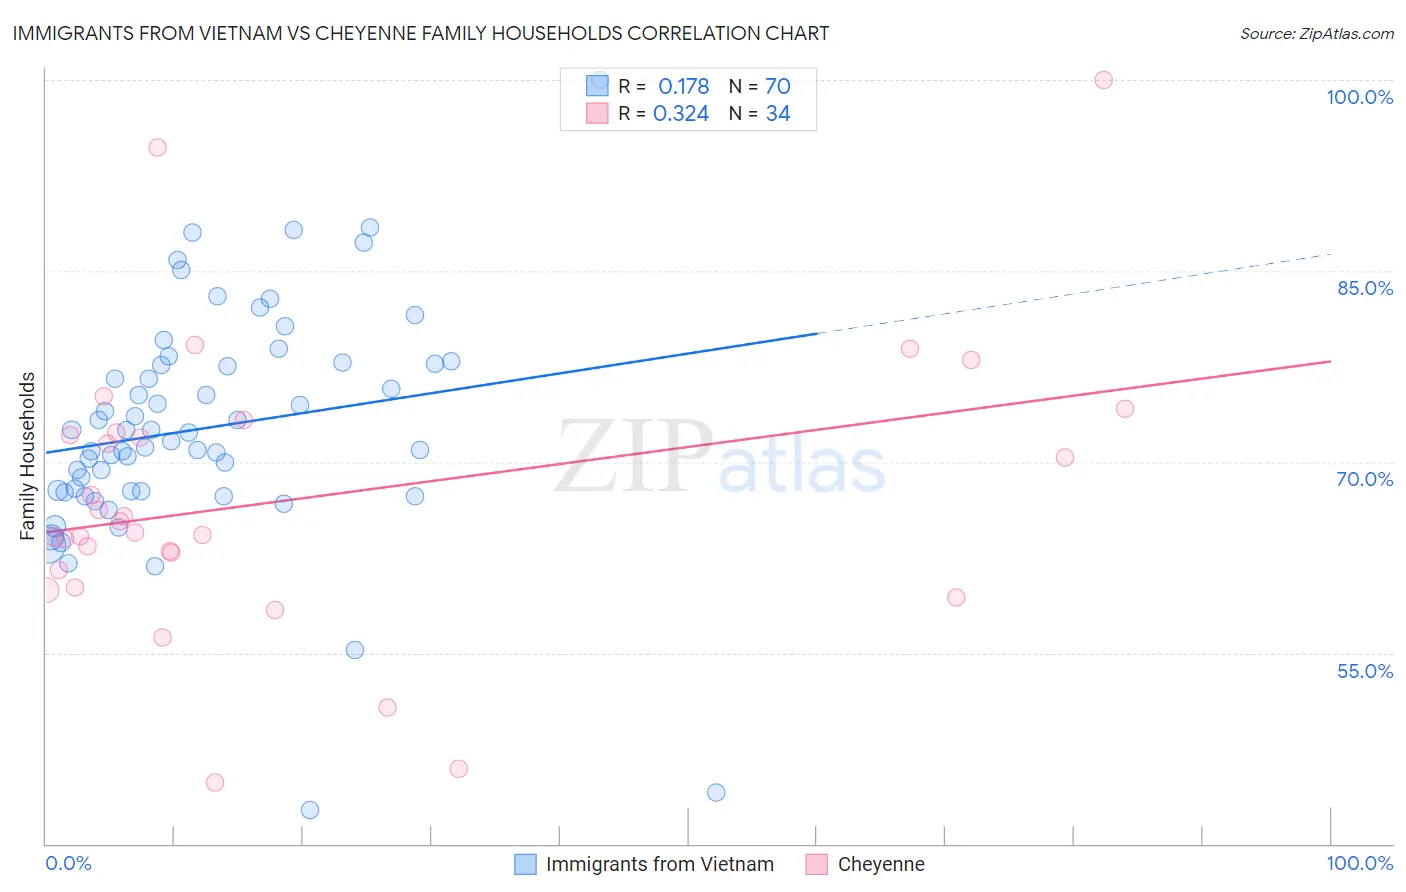
Immigrants from Vietnam vs Cheyenne Family Households Correlation Chart
The statistical analysis conducted on geographies consisting of 404,558,731 people shows a poor positive correlation between the proportion of Immigrants from Vietnam and percentage of family households in the United States with a correlation coefficient (R) of 0.178 and weighted average of 68.2%. Similarly, the statistical analysis conducted on geographies consisting of 80,705,196 people shows a mild positive correlation between the proportion of Cheyenne and percentage of family households in the United States with a correlation coefficient (R) of 0.324 and weighted average of 63.2%, a difference of 7.9%.
Family Households Correlation Summary
| Measurement | Immigrants from Vietnam | Cheyenne |
| Minimum | 42.7% | 44.8% |
| Maximum | 100.0% | 100.0% |
| Range | 57.3% | 55.2% |
| Mean | 72.6% | 67.2% |
| Median | 72.0% | 64.9% |
| Interquartile 25% (IQ1) | 67.7% | 61.5% |
| Interquartile 75% (IQ3) | 77.7% | 72.3% |
| Interquartile Range (IQR) | 10.0% | 10.9% |
| Standard Deviation (Sample) | 9.2% | 11.3% |
| Standard Deviation (Population) | 9.1% | 11.1% |
Similar Demographics by Family Households
Demographics Similar to Immigrants from Vietnam by Family Households
In terms of family households, the demographic groups most similar to Immigrants from Vietnam are Assyrian/Chaldean/Syriac (68.2%, a difference of 0.0%), Chinese (68.1%, a difference of 0.030%), Immigrants from Cuba (68.2%, a difference of 0.060%), Pueblo (68.2%, a difference of 0.070%), and Korean (68.3%, a difference of 0.15%).
| Demographics | Rating | Rank | Family Households |
| Native Hawaiians | 100.0 /100 | #9 | Exceptional 68.4% |
| Immigrants | Philippines | 100.0 /100 | #10 | Exceptional 68.3% |
| Immigrants | Central America | 100.0 /100 | #11 | Exceptional 68.3% |
| Koreans | 100.0 /100 | #12 | Exceptional 68.3% |
| Pueblo | 100.0 /100 | #13 | Exceptional 68.2% |
| Immigrants | Cuba | 100.0 /100 | #14 | Exceptional 68.2% |
| Assyrians/Chaldeans/Syriacs | 100.0 /100 | #15 | Exceptional 68.2% |
| Immigrants | Vietnam | 100.0 /100 | #16 | Exceptional 68.2% |
| Chinese | 100.0 /100 | #17 | Exceptional 68.1% |
| Immigrants | Taiwan | 100.0 /100 | #18 | Exceptional 68.0% |
| Samoans | 100.0 /100 | #19 | Exceptional 67.9% |
| Inupiat | 100.0 /100 | #20 | Exceptional 67.8% |
| Cubans | 100.0 /100 | #21 | Exceptional 67.7% |
| Sri Lankans | 100.0 /100 | #22 | Exceptional 67.7% |
| Immigrants | Pakistan | 100.0 /100 | #23 | Exceptional 67.7% |
Demographics Similar to Cheyenne by Family Households
In terms of family households, the demographic groups most similar to Cheyenne are Kenyan (63.2%, a difference of 0.010%), Immigrants from Ireland (63.2%, a difference of 0.020%), Colville (63.2%, a difference of 0.020%), Immigrants from Western Africa (63.1%, a difference of 0.020%), and Immigrants from Russia (63.2%, a difference of 0.030%).
| Demographics | Rating | Rank | Family Households |
| Luxembourgers | 0.9 /100 | #256 | Tragic 63.3% |
| Icelanders | 0.8 /100 | #257 | Tragic 63.3% |
| Immigrants | Barbados | 0.7 /100 | #258 | Tragic 63.2% |
| Immigrants | Western Europe | 0.6 /100 | #259 | Tragic 63.2% |
| Cypriots | 0.6 /100 | #260 | Tragic 63.2% |
| Immigrants | Russia | 0.6 /100 | #261 | Tragic 63.2% |
| Immigrants | Ireland | 0.6 /100 | #262 | Tragic 63.2% |
| Cheyenne | 0.5 /100 | #263 | Tragic 63.2% |
| Kenyans | 0.5 /100 | #264 | Tragic 63.2% |
| Colville | 0.5 /100 | #265 | Tragic 63.2% |
| Immigrants | Western Africa | 0.5 /100 | #266 | Tragic 63.1% |
| Israelis | 0.4 /100 | #267 | Tragic 63.1% |
| Immigrants | Singapore | 0.4 /100 | #268 | Tragic 63.1% |
| Yugoslavians | 0.4 /100 | #269 | Tragic 63.1% |
| Immigrants | Austria | 0.3 /100 | #270 | Tragic 63.1% |