Immigrants from Bangladesh vs Cheyenne Family Households
COMPARE
Immigrants from Bangladesh
Cheyenne
Family Households
Family Households Comparison
Immigrants from Bangladesh
Cheyenne
63.9%
FAMILY HOUSEHOLDS
11.4/ 100
METRIC RATING
208th/ 347
METRIC RANK
63.2%
FAMILY HOUSEHOLDS
0.5/ 100
METRIC RATING
263rd/ 347
METRIC RANK
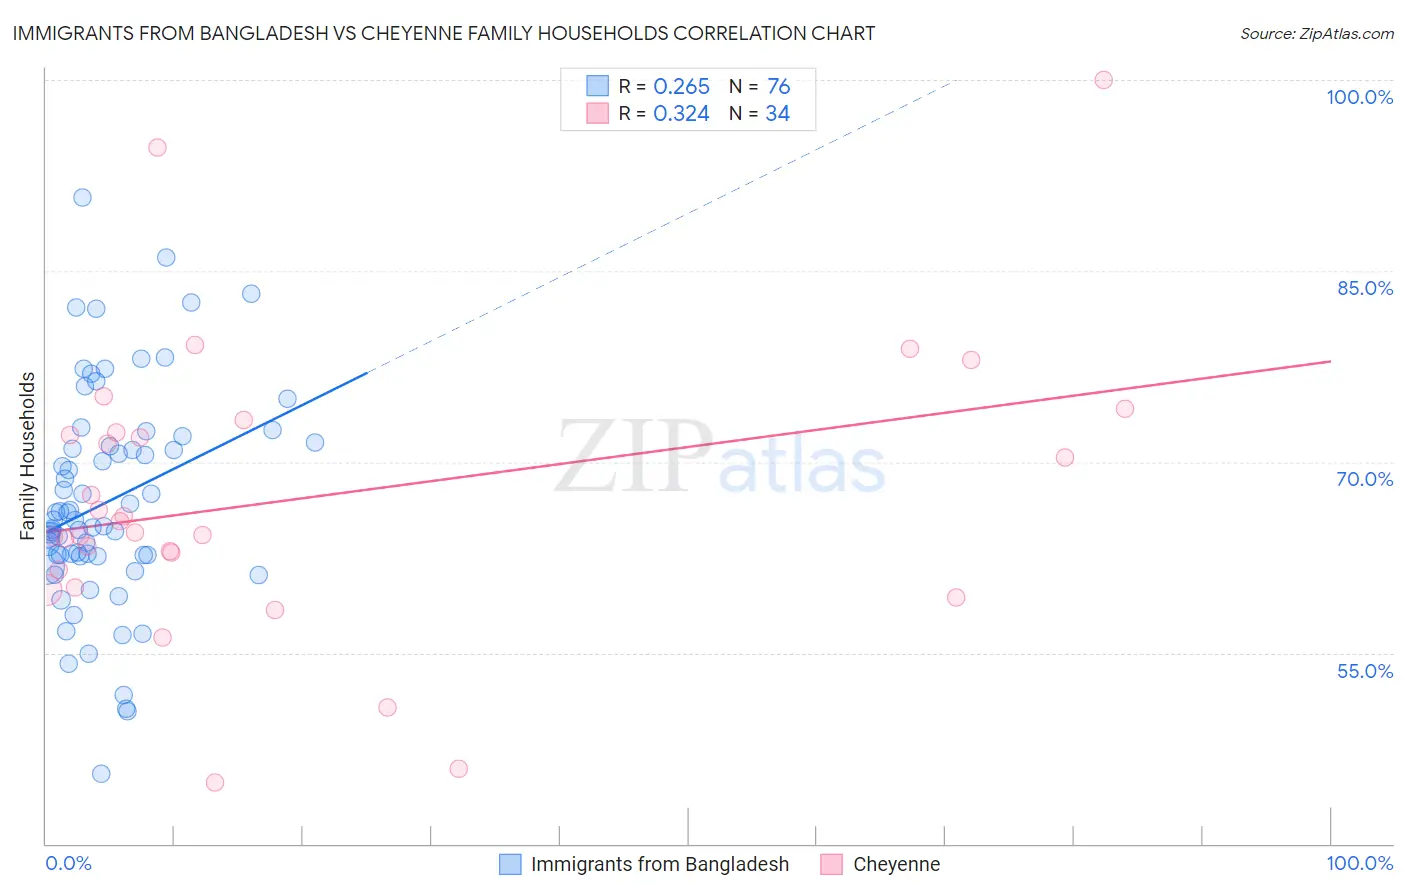
Immigrants from Bangladesh vs Cheyenne Family Households Correlation Chart
The statistical analysis conducted on geographies consisting of 203,582,618 people shows a weak positive correlation between the proportion of Immigrants from Bangladesh and percentage of family households in the United States with a correlation coefficient (R) of 0.265 and weighted average of 63.9%. Similarly, the statistical analysis conducted on geographies consisting of 80,705,196 people shows a mild positive correlation between the proportion of Cheyenne and percentage of family households in the United States with a correlation coefficient (R) of 0.324 and weighted average of 63.2%, a difference of 1.1%.
Family Households Correlation Summary
| Measurement | Immigrants from Bangladesh | Cheyenne |
| Minimum | 45.5% | 44.8% |
| Maximum | 90.8% | 100.0% |
| Range | 45.3% | 55.2% |
| Mean | 66.9% | 67.2% |
| Median | 65.4% | 64.9% |
| Interquartile 25% (IQ1) | 62.6% | 61.5% |
| Interquartile 75% (IQ3) | 71.3% | 72.3% |
| Interquartile Range (IQR) | 8.7% | 10.9% |
| Standard Deviation (Sample) | 8.5% | 11.3% |
| Standard Deviation (Population) | 8.5% | 11.1% |
Similar Demographics by Family Households
Demographics Similar to Immigrants from Bangladesh by Family Households
In terms of family households, the demographic groups most similar to Immigrants from Bangladesh are Nigerian (63.9%, a difference of 0.0%), Sierra Leonean (63.9%, a difference of 0.010%), Immigrants from Lithuania (63.9%, a difference of 0.020%), Brazilian (63.9%, a difference of 0.030%), and Immigrants from Uruguay (63.9%, a difference of 0.040%).
| Demographics | Rating | Rank | Family Households |
| Immigrants | Eastern Europe | 17.2 /100 | #201 | Poor 64.0% |
| Iranians | 13.5 /100 | #202 | Poor 63.9% |
| Norwegians | 13.2 /100 | #203 | Poor 63.9% |
| Immigrants | Uruguay | 12.8 /100 | #204 | Poor 63.9% |
| Brazilians | 12.4 /100 | #205 | Poor 63.9% |
| Immigrants | Lithuania | 12.1 /100 | #206 | Poor 63.9% |
| Nigerians | 11.5 /100 | #207 | Poor 63.9% |
| Immigrants | Bangladesh | 11.4 /100 | #208 | Poor 63.9% |
| Sierra Leoneans | 11.2 /100 | #209 | Poor 63.9% |
| Immigrants | Thailand | 9.6 /100 | #210 | Tragic 63.8% |
| Shoshone | 9.4 /100 | #211 | Tragic 63.8% |
| Immigrants | Netherlands | 9.4 /100 | #212 | Tragic 63.8% |
| Immigrants | Northern Europe | 8.8 /100 | #213 | Tragic 63.8% |
| Celtics | 8.0 /100 | #214 | Tragic 63.8% |
| Belgians | 7.6 /100 | #215 | Tragic 63.8% |
Demographics Similar to Cheyenne by Family Households
In terms of family households, the demographic groups most similar to Cheyenne are Kenyan (63.2%, a difference of 0.010%), Immigrants from Ireland (63.2%, a difference of 0.020%), Colville (63.2%, a difference of 0.020%), Immigrants from Western Africa (63.1%, a difference of 0.020%), and Immigrants from Russia (63.2%, a difference of 0.030%).
| Demographics | Rating | Rank | Family Households |
| Luxembourgers | 0.9 /100 | #256 | Tragic 63.3% |
| Icelanders | 0.8 /100 | #257 | Tragic 63.3% |
| Immigrants | Barbados | 0.7 /100 | #258 | Tragic 63.2% |
| Immigrants | Western Europe | 0.6 /100 | #259 | Tragic 63.2% |
| Cypriots | 0.6 /100 | #260 | Tragic 63.2% |
| Immigrants | Russia | 0.6 /100 | #261 | Tragic 63.2% |
| Immigrants | Ireland | 0.6 /100 | #262 | Tragic 63.2% |
| Cheyenne | 0.5 /100 | #263 | Tragic 63.2% |
| Kenyans | 0.5 /100 | #264 | Tragic 63.2% |
| Colville | 0.5 /100 | #265 | Tragic 63.2% |
| Immigrants | Western Africa | 0.5 /100 | #266 | Tragic 63.1% |
| Israelis | 0.4 /100 | #267 | Tragic 63.1% |
| Immigrants | Singapore | 0.4 /100 | #268 | Tragic 63.1% |
| Yugoslavians | 0.4 /100 | #269 | Tragic 63.1% |
| Immigrants | Austria | 0.3 /100 | #270 | Tragic 63.1% |