Immigrants from Syria vs Latvian Married-couple Households
COMPARE
Immigrants from Syria
Latvian
Married-couple Households
Married-couple Households Comparison
Immigrants from Syria
Latvians
47.1%
MARRIED-COUPLE HOUSEHOLDS
81.6/ 100
METRIC RATING
147th/ 347
METRIC RANK
47.9%
MARRIED-COUPLE HOUSEHOLDS
96.5/ 100
METRIC RATING
97th/ 347
METRIC RANK
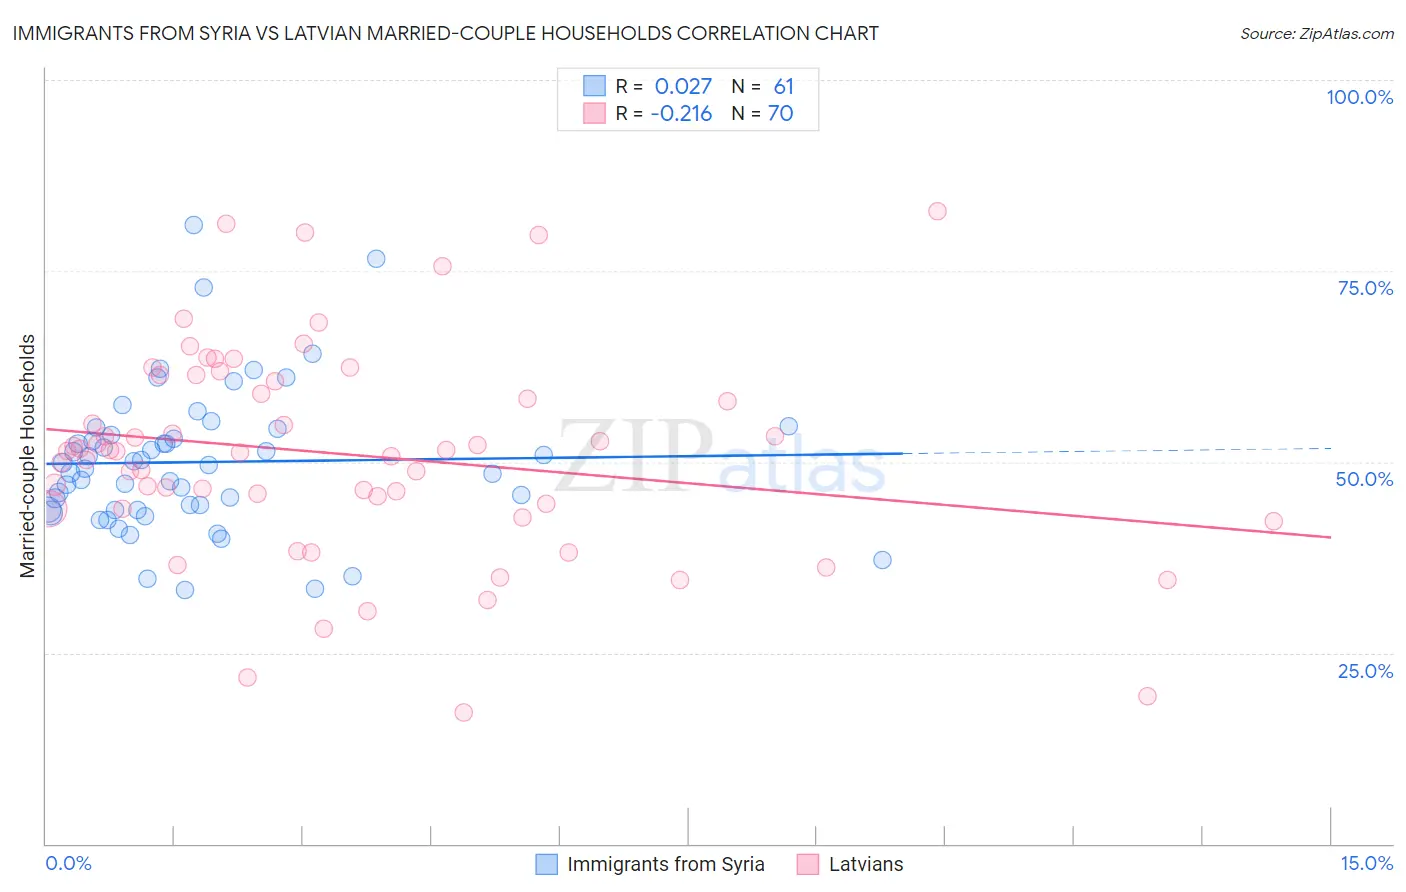
Immigrants from Syria vs Latvian Married-couple Households Correlation Chart
The statistical analysis conducted on geographies consisting of 174,106,206 people shows no correlation between the proportion of Immigrants from Syria and percentage of married-couple family households in the United States with a correlation coefficient (R) of 0.027 and weighted average of 47.1%. Similarly, the statistical analysis conducted on geographies consisting of 220,654,230 people shows a weak negative correlation between the proportion of Latvians and percentage of married-couple family households in the United States with a correlation coefficient (R) of -0.216 and weighted average of 47.9%, a difference of 1.7%.
Married-couple Households Correlation Summary
| Measurement | Immigrants from Syria | Latvian |
| Minimum | 33.2% | 17.2% |
| Maximum | 81.0% | 82.8% |
| Range | 47.8% | 65.5% |
| Mean | 50.0% | 51.0% |
| Median | 49.5% | 51.4% |
| Interquartile 25% (IQ1) | 43.7% | 43.9% |
| Interquartile 75% (IQ3) | 53.9% | 60.6% |
| Interquartile Range (IQR) | 10.2% | 16.7% |
| Standard Deviation (Sample) | 9.4% | 13.8% |
| Standard Deviation (Population) | 9.4% | 13.7% |
Similar Demographics by Married-couple Households
Demographics Similar to Immigrants from Syria by Married-couple Households
In terms of married-couple households, the demographic groups most similar to Immigrants from Syria are Immigrants from Western Europe (47.1%, a difference of 0.0%), Slovene (47.1%, a difference of 0.010%), Mexican (47.1%, a difference of 0.12%), Icelander (47.0%, a difference of 0.12%), and Immigrants from Belarus (47.2%, a difference of 0.14%).
| Demographics | Rating | Rank | Married-couple Households |
| Spanish | 84.5 /100 | #140 | Excellent 47.2% |
| Costa Ricans | 84.4 /100 | #141 | Excellent 47.2% |
| Spaniards | 84.1 /100 | #142 | Excellent 47.2% |
| Immigrants | Belarus | 83.8 /100 | #143 | Excellent 47.2% |
| Mexicans | 83.4 /100 | #144 | Excellent 47.1% |
| Slovenes | 81.7 /100 | #145 | Excellent 47.1% |
| Immigrants | Western Europe | 81.6 /100 | #146 | Excellent 47.1% |
| Immigrants | Syria | 81.6 /100 | #147 | Excellent 47.1% |
| Icelanders | 79.5 /100 | #148 | Good 47.0% |
| Paraguayans | 78.7 /100 | #149 | Good 47.0% |
| Immigrants | Russia | 77.6 /100 | #150 | Good 47.0% |
| Immigrants | Bulgaria | 76.8 /100 | #151 | Good 47.0% |
| Serbians | 76.3 /100 | #152 | Good 47.0% |
| Hmong | 76.2 /100 | #153 | Good 47.0% |
| Immigrants | Western Asia | 76.1 /100 | #154 | Good 46.9% |
Demographics Similar to Latvians by Married-couple Households
In terms of married-couple households, the demographic groups most similar to Latvians are Immigrants from North Macedonia (47.9%, a difference of 0.010%), Immigrants from Austria (47.9%, a difference of 0.020%), Immigrants from Egypt (47.9%, a difference of 0.030%), Immigrants from Italy (47.9%, a difference of 0.030%), and Immigrants from Belgium (47.9%, a difference of 0.080%).
| Demographics | Rating | Rank | Married-couple Households |
| French | 97.2 /100 | #90 | Exceptional 48.0% |
| Immigrants | Moldova | 97.0 /100 | #91 | Exceptional 48.0% |
| Palestinians | 96.9 /100 | #92 | Exceptional 48.0% |
| Lebanese | 96.9 /100 | #93 | Exceptional 47.9% |
| Americans | 96.9 /100 | #94 | Exceptional 47.9% |
| Immigrants | Belgium | 96.8 /100 | #95 | Exceptional 47.9% |
| Immigrants | Egypt | 96.6 /100 | #96 | Exceptional 47.9% |
| Latvians | 96.5 /100 | #97 | Exceptional 47.9% |
| Immigrants | North Macedonia | 96.4 /100 | #98 | Exceptional 47.9% |
| Immigrants | Austria | 96.4 /100 | #99 | Exceptional 47.9% |
| Immigrants | Italy | 96.3 /100 | #100 | Exceptional 47.9% |
| Turks | 96.1 /100 | #101 | Exceptional 47.8% |
| Slavs | 96.0 /100 | #102 | Exceptional 47.8% |
| Hawaiians | 96.0 /100 | #103 | Exceptional 47.8% |
| Immigrants | South Africa | 96.0 /100 | #104 | Exceptional 47.8% |