Czech vs Latvian Married-couple Households
COMPARE
Czech
Latvian
Married-couple Households
Married-couple Households Comparison
Czechs
Latvians
49.4%
MARRIED-COUPLE HOUSEHOLDS
99.9/ 100
METRIC RATING
24th/ 347
METRIC RANK
47.9%
MARRIED-COUPLE HOUSEHOLDS
96.5/ 100
METRIC RATING
97th/ 347
METRIC RANK
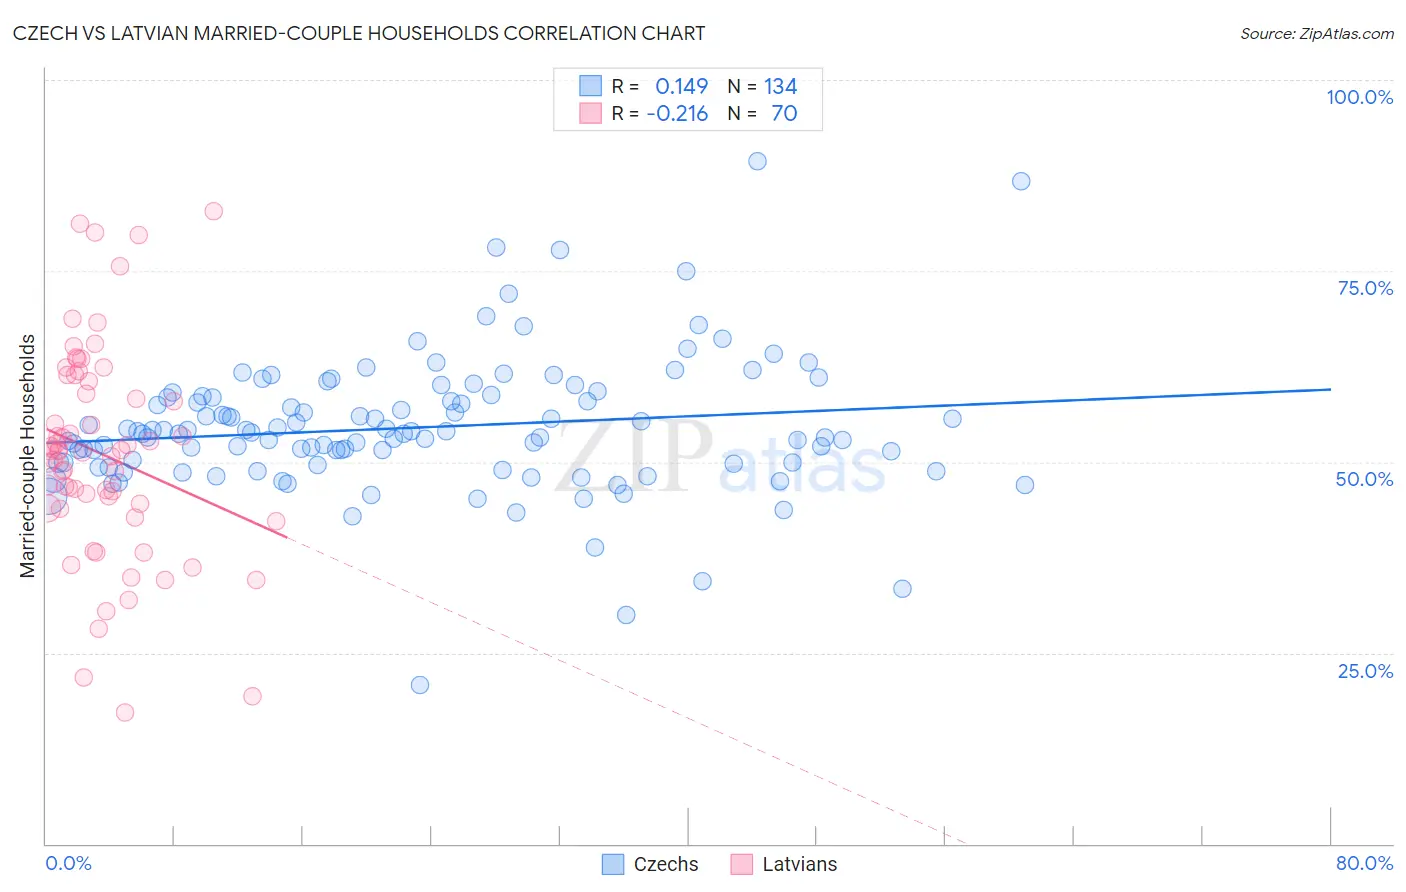
Czech vs Latvian Married-couple Households Correlation Chart
The statistical analysis conducted on geographies consisting of 484,447,060 people shows a poor positive correlation between the proportion of Czechs and percentage of married-couple family households in the United States with a correlation coefficient (R) of 0.149 and weighted average of 49.4%. Similarly, the statistical analysis conducted on geographies consisting of 220,654,230 people shows a weak negative correlation between the proportion of Latvians and percentage of married-couple family households in the United States with a correlation coefficient (R) of -0.216 and weighted average of 47.9%, a difference of 3.2%.
Married-couple Households Correlation Summary
| Measurement | Czech | Latvian |
| Minimum | 20.8% | 17.2% |
| Maximum | 89.3% | 82.8% |
| Range | 68.5% | 65.5% |
| Mean | 54.5% | 51.0% |
| Median | 53.7% | 51.4% |
| Interquartile 25% (IQ1) | 49.8% | 43.9% |
| Interquartile 75% (IQ3) | 58.5% | 60.6% |
| Interquartile Range (IQR) | 8.6% | 16.7% |
| Standard Deviation (Sample) | 9.0% | 13.8% |
| Standard Deviation (Population) | 9.0% | 13.7% |
Similar Demographics by Married-couple Households
Demographics Similar to Czechs by Married-couple Households
In terms of married-couple households, the demographic groups most similar to Czechs are Dutch (49.5%, a difference of 0.080%), Asian (49.5%, a difference of 0.090%), Immigrants from Philippines (49.3%, a difference of 0.19%), Norwegian (49.5%, a difference of 0.20%), and European (49.6%, a difference of 0.26%).
| Demographics | Rating | Rank | Married-couple Households |
| Immigrants | Hong Kong | 99.9 /100 | #17 | Exceptional 49.6% |
| English | 99.9 /100 | #18 | Exceptional 49.6% |
| Europeans | 99.9 /100 | #19 | Exceptional 49.6% |
| Scandinavians | 99.9 /100 | #20 | Exceptional 49.6% |
| Norwegians | 99.9 /100 | #21 | Exceptional 49.5% |
| Asians | 99.9 /100 | #22 | Exceptional 49.5% |
| Dutch | 99.9 /100 | #23 | Exceptional 49.5% |
| Czechs | 99.9 /100 | #24 | Exceptional 49.4% |
| Immigrants | Philippines | 99.9 /100 | #25 | Exceptional 49.3% |
| Immigrants | Scotland | 99.8 /100 | #26 | Exceptional 49.3% |
| Bhutanese | 99.8 /100 | #27 | Exceptional 49.3% |
| Germans | 99.8 /100 | #28 | Exceptional 49.2% |
| Maltese | 99.8 /100 | #29 | Exceptional 49.2% |
| Bolivians | 99.8 /100 | #30 | Exceptional 49.2% |
| Native Hawaiians | 99.8 /100 | #31 | Exceptional 49.1% |
Demographics Similar to Latvians by Married-couple Households
In terms of married-couple households, the demographic groups most similar to Latvians are Immigrants from North Macedonia (47.9%, a difference of 0.010%), Immigrants from Austria (47.9%, a difference of 0.020%), Immigrants from Egypt (47.9%, a difference of 0.030%), Immigrants from Italy (47.9%, a difference of 0.030%), and Immigrants from Belgium (47.9%, a difference of 0.080%).
| Demographics | Rating | Rank | Married-couple Households |
| French | 97.2 /100 | #90 | Exceptional 48.0% |
| Immigrants | Moldova | 97.0 /100 | #91 | Exceptional 48.0% |
| Palestinians | 96.9 /100 | #92 | Exceptional 48.0% |
| Lebanese | 96.9 /100 | #93 | Exceptional 47.9% |
| Americans | 96.9 /100 | #94 | Exceptional 47.9% |
| Immigrants | Belgium | 96.8 /100 | #95 | Exceptional 47.9% |
| Immigrants | Egypt | 96.6 /100 | #96 | Exceptional 47.9% |
| Latvians | 96.5 /100 | #97 | Exceptional 47.9% |
| Immigrants | North Macedonia | 96.4 /100 | #98 | Exceptional 47.9% |
| Immigrants | Austria | 96.4 /100 | #99 | Exceptional 47.9% |
| Immigrants | Italy | 96.3 /100 | #100 | Exceptional 47.9% |
| Turks | 96.1 /100 | #101 | Exceptional 47.8% |
| Slavs | 96.0 /100 | #102 | Exceptional 47.8% |
| Hawaiians | 96.0 /100 | #103 | Exceptional 47.8% |
| Immigrants | South Africa | 96.0 /100 | #104 | Exceptional 47.8% |